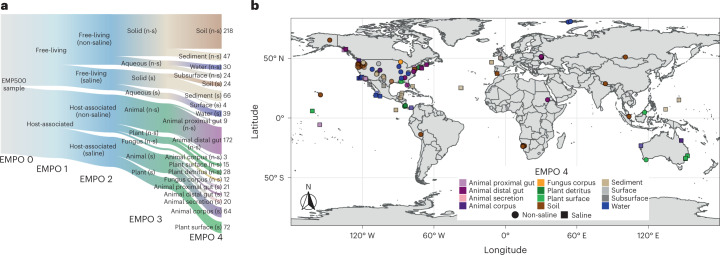
Fig. 1. Environment type and provenance of samples.
a, Distribution of samples (n = 880) among the Earth Microbiome Project Ontology (EMPO version 2) categories. EMPO recognizes strong axes of variation in microbial communities, and thus organizes all microbial environments (level 4) on the basis of host association (level 1), salinity (level 2), host taxon (for host-associated) or phase (free-living) (level 3). For EMPO 3 and EMPO 4: n-s, non-saline; s, saline. Colours indicate environments. Numbers indicate sample counts for each environment. Made with JSFiddle. b, Geographic distribution of samples with points coloured by EMPO 4. Points are transparent to highlight cases where multiple samples derive from a single location. We note here that our intent was to sample across environments rather than geography, in part because we previously showed that microbial community composition is more influenced by the former rather than the latter, but also to motivate finer-grained geographic exploration as sample analyses decrease in cost. Extensive information about each sample set is described in Supplementary Table 1. Made with Natural Earth.

