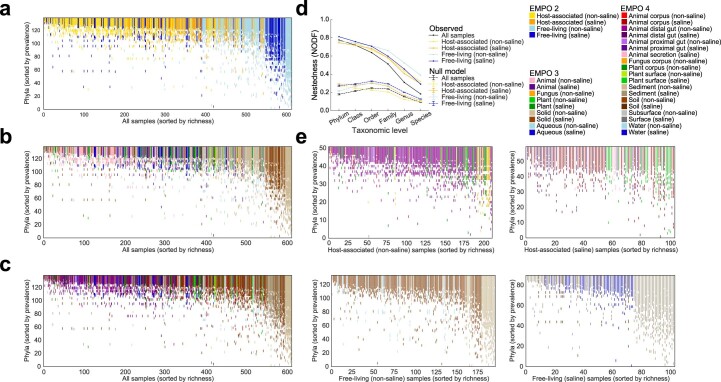
Extended Data Fig. 6. Nestedness of community composition based on microbial taxa.
Presence-absence of phyla across samples, with phyla (rows) sorted by prevalence and samples (columns, n = 612) sorted by richness. With increasing sample richness, phyla tended to be gained but not lost (SES = 91.86, p-value < 0.0001 vs. a null model; nestedness measure based on overlap and decreasing fills [NODF] statistic = 0.78). Samples are colored by EMPO 2. b, As in a but with samples colored by EMPO 3. c, As in a but with samples colored by EMPO 4. d, Nestedness as a function of taxonomic level, from phylum to species, across all samples and within environments based on EMPO 2. Also shown are median null model NODF scores (± s.d.) for all samples, as well as samples at each level of EMPO 2. NODF measures the average fraction of taxa from less diverse communities that occur in more diverse communities. All environments at all taxonomic levels examined were more nested than expected randomly, with nestedness higher at higher taxonomic levels (p-value < 0.0001 for all comparisons, from two-tailed tests). e, As in c but with each environment at EMPO 2 shown separately, with samples colored by EMPO 4.

