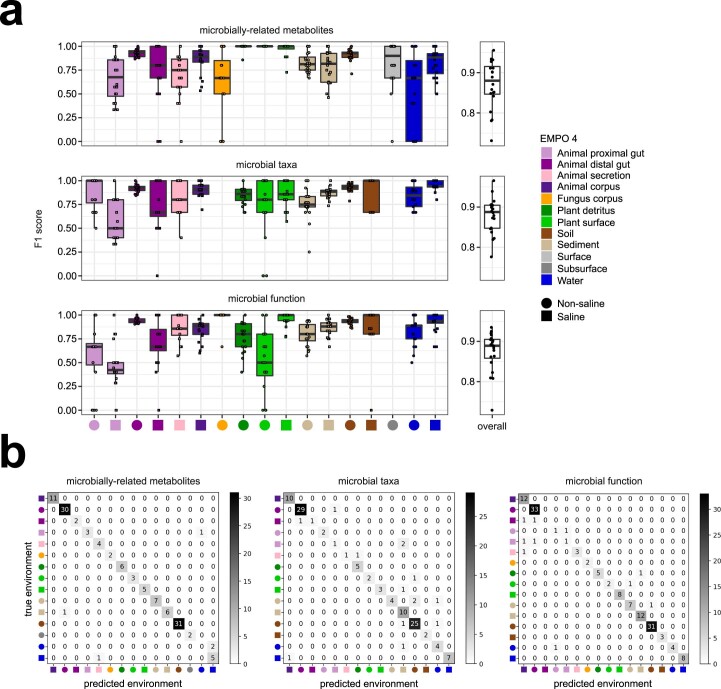
Extended Data Fig. 7. Machine-learning analysis of microbially-related metabolites, microbial taxa, and microbial functions, highlighting per-environment classification performance.
a, The F1 score (that is, which considers precision and recall) for each environment as well as overall across all environments. For each data layer, every environment is represented by n = 20 iterations. b, Confusion matrices for each data layer highlighting which pairs of environments are confused. Boxplots are in the style of Tukey, where the center line indicates the median, lower and upper hinges the first- and third quartiles, respectively, and each whisker 1.5 x the interquartile range (IQR) from its respective hinge. For all analyses, environments are described by the Earth Microbiome Project Ontology (EMPO 4).

