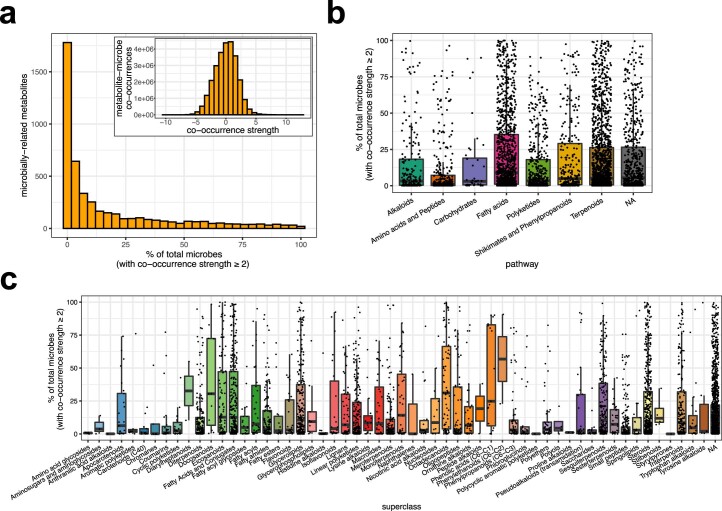
Extended Data Fig. 8. Summary of co-occurrence ranks for microbially-related metabolites.
a, Distribution of the percentage of microbial taxa for which co-occurrences were strong. Strong co-occurrence was defined as having a co-occurrence strength (that is, rank, or log conditional probability) ≥ 2. The overall distribution of co-occurrence strengths is shown in the inset (n = 26,784,120). For values > 0 (n = 13,851,755), the minimum = –10.17, maximum = 12.69, mean = 2.40 x 10⁻¹⁸, median = 0.08, and mode = 1.22. For values ≥ 2 (n = 3,496,639), the minimum = 2.00, maximum = 12.69, mean = 2.87, median = 2.63, and mode = 4.26. b, The percentage of microbial taxa for which co-occurrences were strong (that is, ≥ 2), across metabolite pathways. c, The percentage of microbial taxa for which co-occurrences were strong (that is, ≥ 2), across metabolite superclasses. For panels b and c, points were jittered horizontally for clarity, and n = 4,765 metabolites. Boxplots are in the style of Tukey, where the center line indicates the median, lower and upper hinges the first- and third quartiles, respectively, and each whisker 1.5 x the interquartile range (IQR) from its respective hinge.

