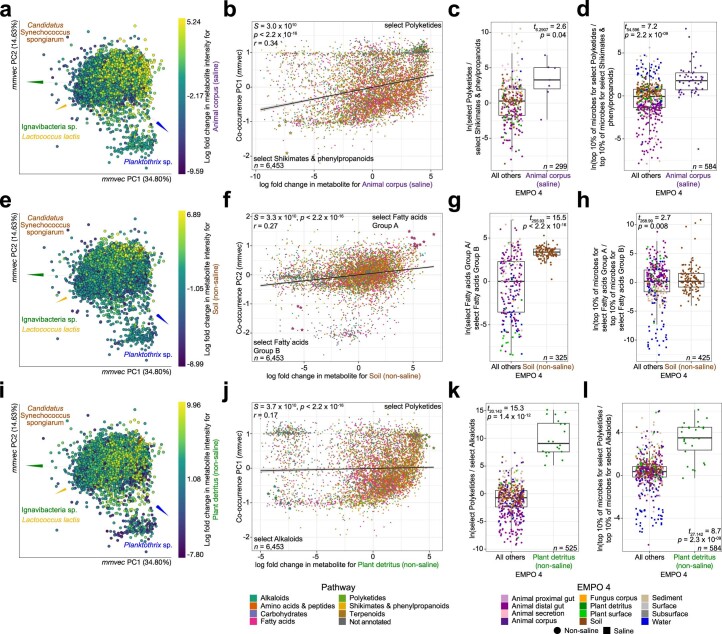
Extended Data Fig. 10. Metabolite-microbe co-occurrences reveal exhibit strong turnover across environments.
Results from three environments in addition to ‘Water (saline)’, to highlight differences driven by salinity and host-association: ‘Animal corpus (saline)’, ‘Soil (non-saline)’, and ‘Plant detritus (non-saline’). a, e, i, The relationship between log fold changes in abundance for metabolites with respect to the focal environment, and the first three co-occurrence PCs. See Fig. 5 for details. b, f, j The relationship between log fold changes in metabolite abundances with respect to the focal environment and loadings for metabolites on PC1 of the co-occurrence ordination. The correlations are examples from Fig. 5a. Metabolites are colored by pathway. Select features representing the focal group and reference group are highlighted, and are described along with the top ten co-occurring microbial taxa for each group in Supplementary Table S5. P-values are from two-tailed tests, and were adjusted for multiple comparisons using the Benjamini Hochberg procedure. c, g, k, Log-ratio of metabolite intensities for select focal group features and select reference group features with respect to the focal environment. d, h, l, Log-ratio of abundances of the top ten microbial taxa associated with focal group metabolites and with reference group metabolites, with respect to the focal environment (see Supplementary Table S5). For panels c, d, g, h, k, and l, points represent samples, and results from a two-sided t-test comparing the focal vs. all other environments are shown. Boxplots are Tukey’s, where the center indicates the median, lower and upper hinges the first- and third quartiles, respectively, and each whisker 1.5 x the interquartile range (IQR) from its hinge.

