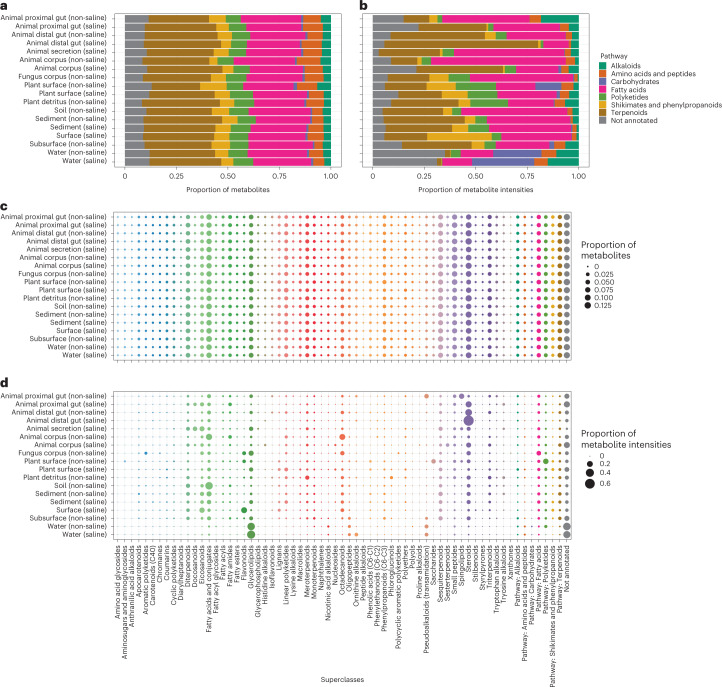
Fig. 2. Distribution of microbially related secondary metabolite pathways and superclasses among environments.
a–d, Individual metabolites are represented by their higher-level classifications. Both chemical pathway and chemical superclass annotations are shown on the basis of presence/absence (a,c) and relative intensities (b,d) of molecular features, respectively. For superclass annotations in c and d, we included pathway annotations (when possible) for metabolites where superclass annotations were not available, and colours identify superclasses and pathways.

