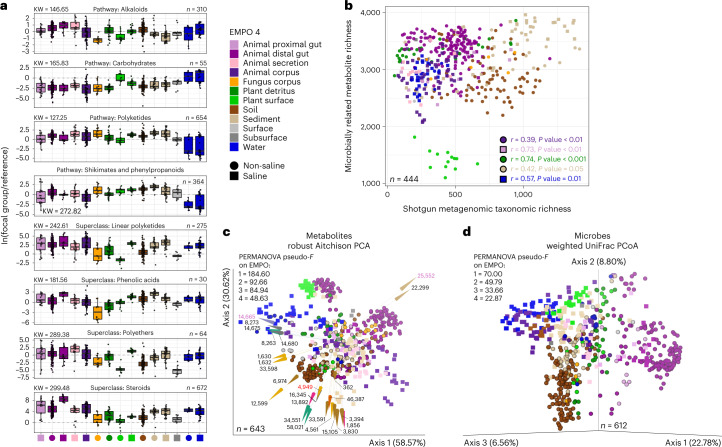
Fig. 3. Structural-level associations between microbially related secondary metabolites and specific environments.
a, Differential abundance of metabolites across environments. For each panel, the y axis represents the natural log-ratio of the intensities of ingroup metabolites divided by the intensities of reference group metabolites (that is, pathway reference: Amino acids and peptides, n = 615; superclass reference: Flavonoids, n = 42). The number of metabolites in each ingroup and the chi-squared statistic from a Kruskal–Wallis (KW) test for differences across environments are shown. For each test, n = 606 samples and P < 2.2 × 10⁻¹⁶. Boxplots are Tukey’s, where the centre indicates the median, lower and upper hinges the first and third quartiles, respectively, and each whisker is 1.5× the interquartile range (IQR) from its hinge. b, Relationship between metabolite richness and microbial taxon richness, with significant correlations noted. P values are from two-tailed tests and were adjusted using the Benjamini-Hochberg procedure. c, Turnover in composition of metabolites across environments, visualized using RPCA, showing samples separated on the basis of metabolite abundances. Shapes represent samples. Arrows represent metabolites and are coloured by chemical pathway. The direction and magnitude of each arrow corresponds to the correlation between the metabolite’s abundance and the ordination axes. Samples close to arrow heads have strong positive associations, samples at arrow origins have no association, and those beyond arrow origins have strong negative associations. Metabolites are described in Supplementary Table 4. Metabolites annotated in red and purple were also highly differentially abundant across environments (Supplementary Table 3), and those in purple were also identified as important in co-occurrence analyses (Fig. 4). d, Turnover in composition of microbial taxa across environments, visualized using PCoA of weighted UniFrac distances. For c and d, results from PERMANOVA (999 permutations) for each level of EMPO are shown (all tests had P = 0.001; group sizes for metabolites: kEMPO1 = 2, kEMPO2 = 4, kEMPO3 = 9, kEMPO4 = 18; group sizes for microbial taxa: kEMPO1 = 2, kEMPO2 = 4, kEMPO3 = 9, kEMPO4 = 19). Sample sizes in a refer to metabolites, but in all other panels refer to samples.

