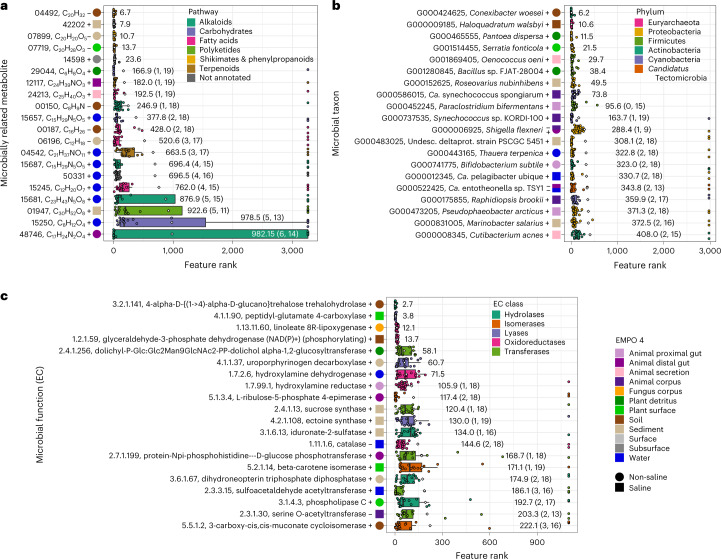
Fig. 4. Machine-learning analysis of microbially related metabolites, microbial taxa and microbial functions, highlighting the top 20 most impactful features for each dataset.
a, The top 20 most impactful microbially related metabolites. Features are coloured by metabolite pathway. Metabolites in bold font are those also identified as important in differential abundance analysis (Supplementary Table 3). b, The top 20 most impactful microbial taxa (that is, OGUs). Taxa are coloured by phylum. c, The top 20 most impactful microbial functions (that is, KEGG ECs). Boxplots are in the style of Tukey, where the centre line indicates the median, lower and upper hinges the first and third quartiles, respectively, and each whisker is 1.5× IQR from its respective hinge. Enzymes are coloured by class. For all features, ranks are based on impacts derived from SHAP values. Associations with environments are indicated, where + indicates a positive association and – indicates a negative association based on feature abundances. Diamonds and values to the right of boxes indicate means. Values in parentheses indicate (1) the number of iterations (n = 20) in which a feature had no impact and (2) the number of iterations in which the reported association was observed, for cases in which values were <20. Environments are described by the Earth Microbiome Project Ontology (EMPO 4).

