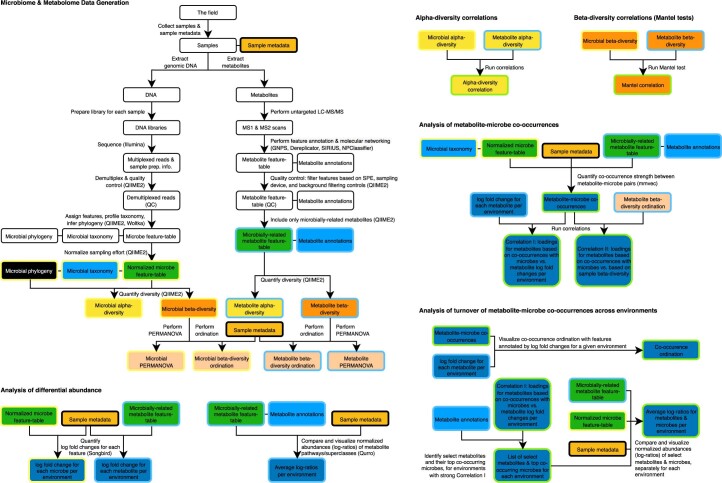
Extended Data Fig. 1. Diagrammatic overview of multi-omics analyses performed using the EMP500 dataset.
The process begins with data generation for both the microbiome and metabolome, which is then followed by analysis of differential abundance of both microbial taxa and microbially-related metabolites across environments. To begin multi-omics integration, correlations between alpha- and beta-diversity are explored, followed by explicit co-occurrence analysis of metabolite-microbe pairs. The results from analysis of co-occurrence are then combined with those from analysis of differential abundance, to reveal strong patterns of metabolite-microbe turnover across environments. Throughout the diagram, artifacts derived from microbial data are outlined in yellow, those derived from metabolite data are outlined in blue, and those derived from co-occurrence analysis are outlined in green.

