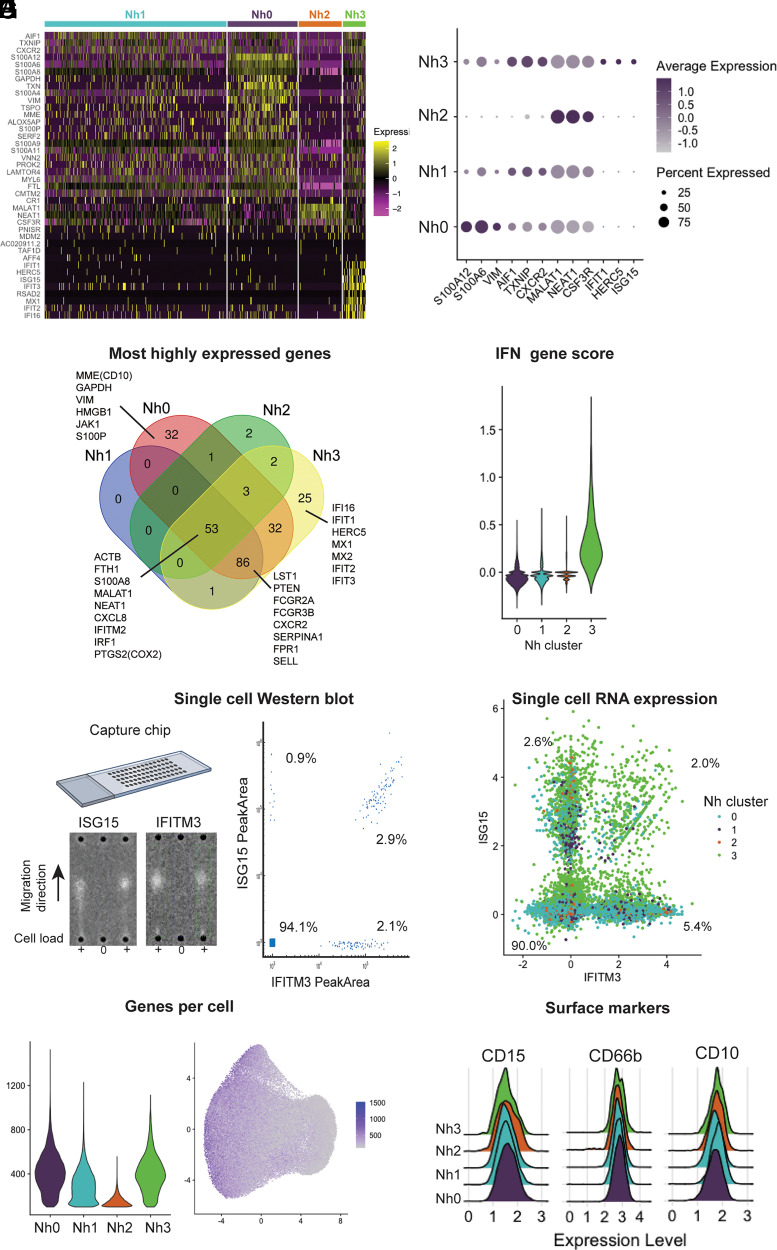
FIGURE 3.
Neutrophil transcriptional subsets vary by type and number of genes expressed. (A) Heatmap of the top marker genes from each cluster. Each row represents one gene, and each column represents one cell. The cells corresponding to each cluster are grouped, as indicated by the colored bars. The top marker genes were defined by their adjusted p value and log2 (fold difference) on differential expression analysis (expression in a cluster versus expression in all other clusters). Genes with adjusted p = 0 and log2 (fold difference) ≥ 0.5 in any cluster are shown. (B) Dot plot of the top three marker genes for each neutrophil cluster, showing the average expression level and the percent of cells expressing the gene in each cluster. (C) Venn diagram displaying the intersection of the top genes in each cluster by absolute expression. (D) Violin plot showing the score per cluster for a panel of IFN-related genes, as described by Aran et al. (27). (E) Single-cell Western blot on 3300 neutrophils, with Abs against the proteins ISG15 and IFITM3. A representative blot is shown on the left, and a bivariate plot of the estimated single-cell abundances (peak areas) is displayed on the right. (F) Neutrophil single-cell RNA expression of the same targets as in (E): ISG15 and IFITM3. (G) Violin plot of the number of genes per cell in each cluster (left) and distribution of the number of genes per cell on the UMAP projection (right). (H) Ridge plots showing the distribution of CD10, CD15, and CD66b surface protein expression among cells in each transcriptional cluster. Surface expression and RNA-seq were measured simultaneously, by Cellular Indexing of Transcriptomes and Epitopes by Sequencing (CITE-seq). Data for 11 additional neutrophil surface markers are shown in Supplemental Fig. 2.

