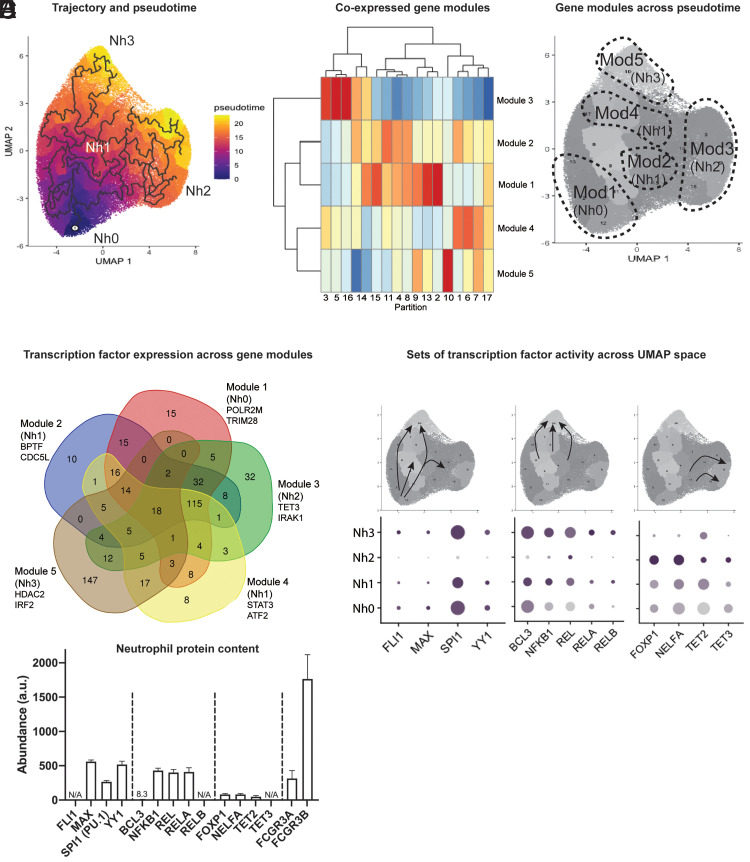
FIGURE 4.
Nh2 and Nh3 cells are end points in the transcriptional trajectory of circulating human neutrophils. (A) Trajectory analysis showing the learned graph on the UMAP space with the pseudotime ordering by color. (B) Heatmap showing unsupervised classification of genes that vary across clusters of circulating neutrophils into five clusters of coexpressed genes. (C) Correspondence between the five modules of coexpressed genes and the four transcriptional clusters of circulating human neutrophils. (D) Venn diagram of transcription factors associated with cis-regulatory elements most likely to regulate the coexpressed genes in each module. Gene lists from the modules were used as input in BART. The overlap across modules for the top-ranking transcription factors (Irwin–Hall p < 0.01) is shown. (E) Transcription factor gene expression changes along the transcriptional trajectory of circulating human neutrophils. Three patterns are shown: transcription factors expressed along the Nh0-Nh1-Nh3 trajectory, but not in Nh2 cells (left); transcription factors expressed in the transition from Nh1 to Nh3 cells (middle); and transcription factors expressed in the transition from Nh1 to Nh2 cells (right). (F) Mass spectrometry data from bulk neutrophil preparations obtained from five healthy donors, showing relative protein abundances for the transcription factors in (E), with FCGR3A and FCGR3B as abundance references.

