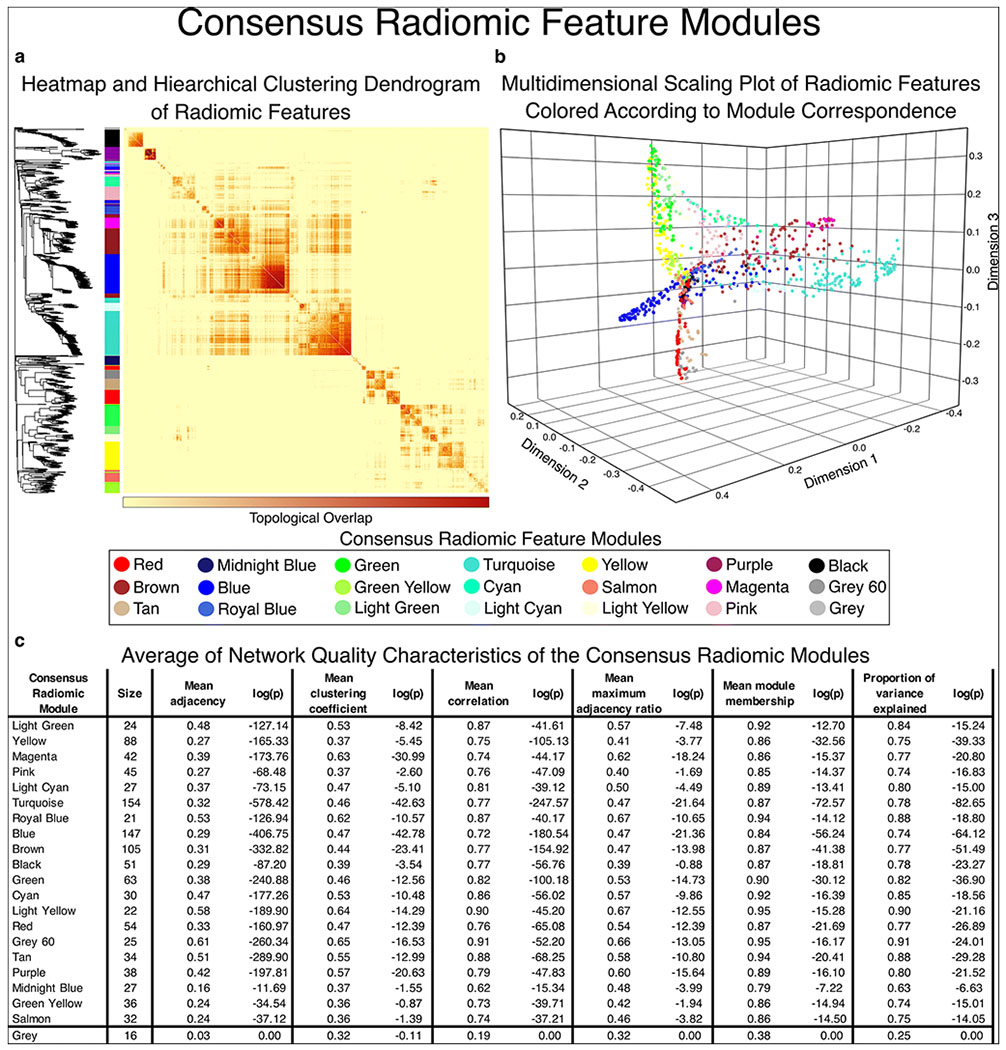
Figure 2.

Visual representation of consensus radiomic feature modules.
Using weighted gene co-expression network analysis, we created a consensus topological overlap matrix which provides a representation of the radiomic profile co-expression considering all three timepoints. a) shows the topological overlap matrix with the corresponding hierarchical clustering dendrogram on the left. Using the dynamic tree-cut algorithm, we identified 20 consensus radiomic feature modules (grey is used to mark features not allocated to any of the modules). b) Plotting the radiomic features in multidimensional latent space we can appreciate that the features corresponding to the modules are grouped close to each other, while separation between the consensus modules can be observed indicating that the modules represent different latent structural components. c) Network quality statistics show that there is high inter-correlation between the elements of each network module. Furthermore, the derived eigen radiomic feature shows high module membership (correlation with the elements of the module) and explains a substantial proportion of the variance of the corresponding features in a given module. These results show that the proposed methodology provides a framework to construct a mathematical representation of the latent structural characteristics of lesions using radiological imaging. Furthermore, this reduces the feature space from 3 timepoints x 1,081 radiomic features to 3 timepoints x 20 consensus eigen radiomic features.
