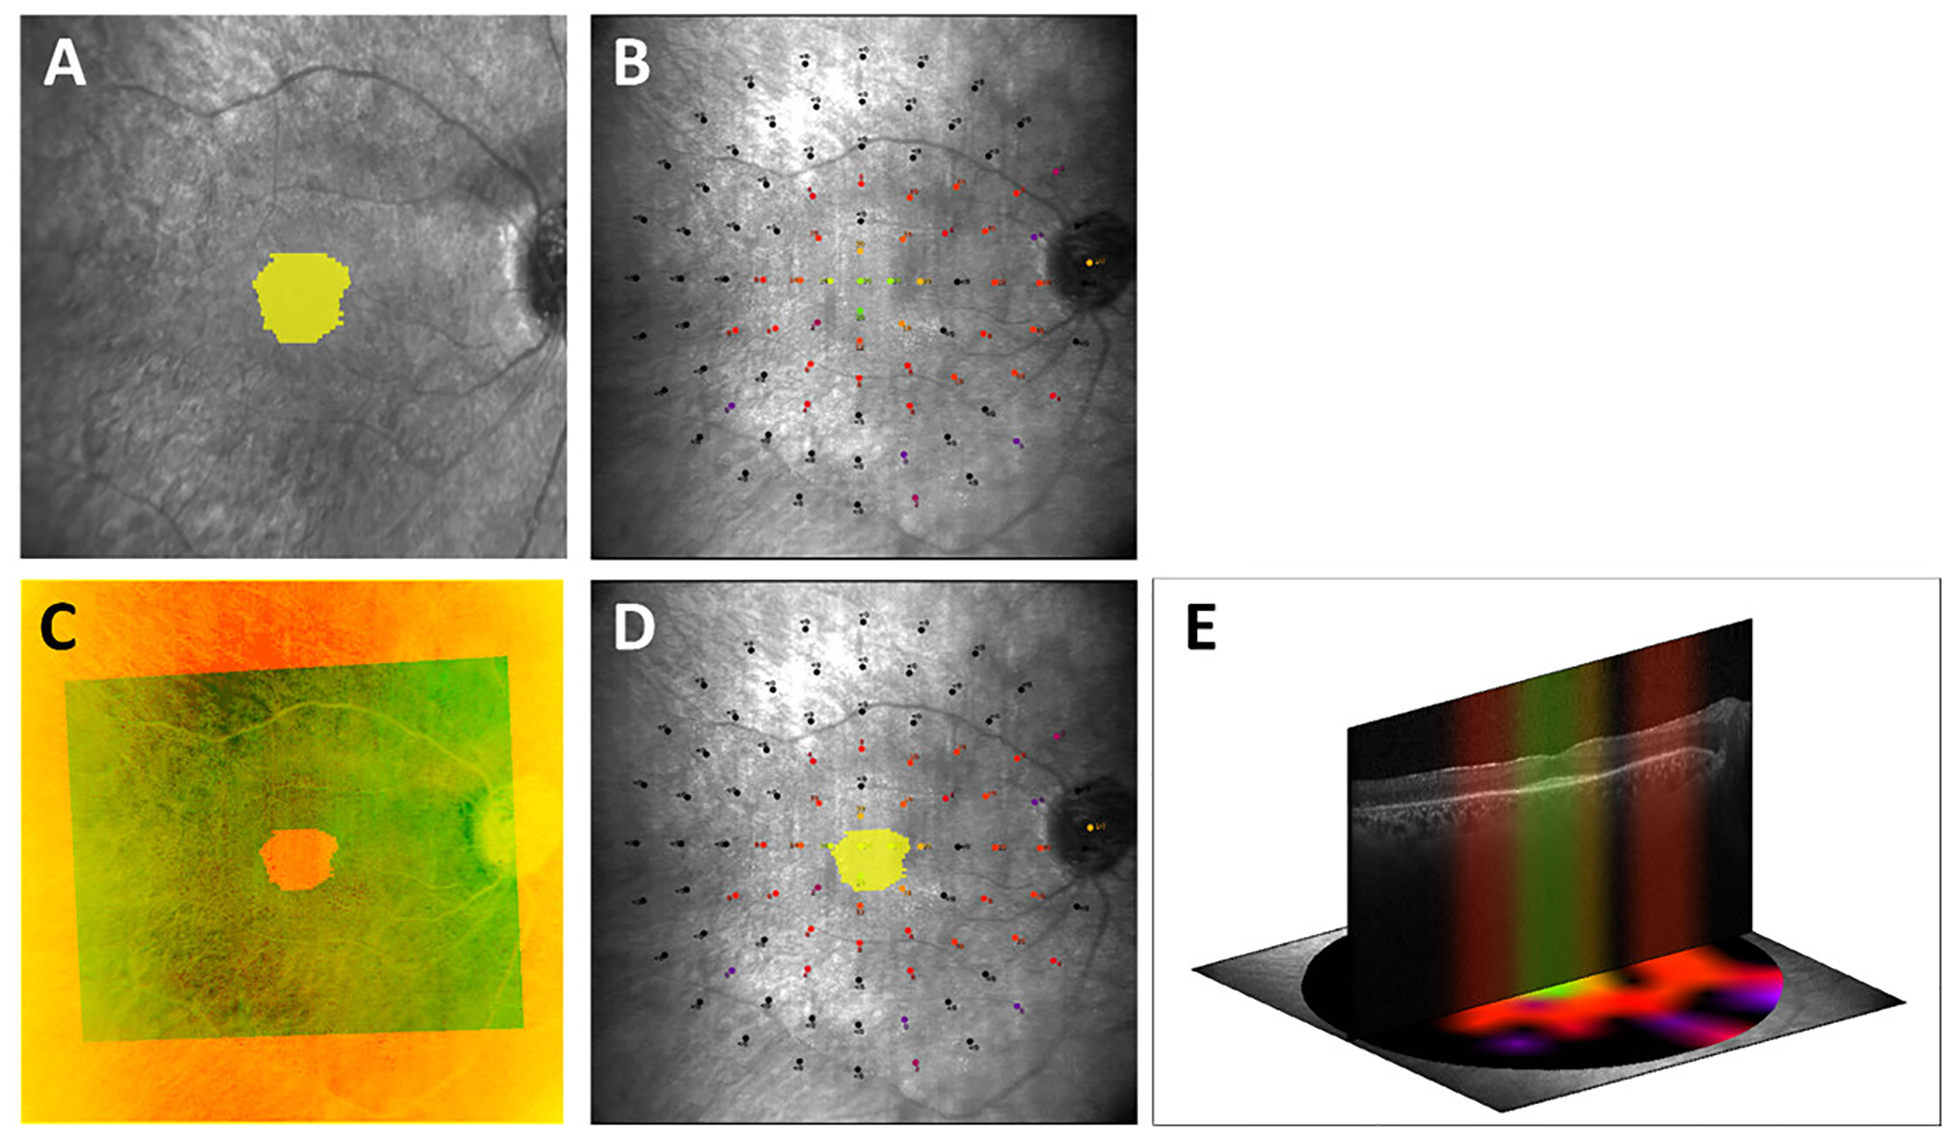
Figure 1. Example of microperimetry-OCT overlay.

Figure 1: A. Intact ellipsoid zone (EZ) area segmented on SD-OCT images (yellow) mapped onto the infrared reflectance (IR) image simultaneously acquired during OCT imaging. B. Microperimetry image. C. IR image acquired simultaneously with SD-OCT image (smaller field of view) registered to the microperimetry fundus image (larger field of view). The near-perfect vessel overlap between the images qualitatively demonstrates the accuracy of the registration. D. Intact EZ area (yellow) mapped onto the microperimetry image. E. Central OCT B-scan with the corresponding sensitivity profile as obtained from the interpolated microperimetry map demonstrates structure-function correlation.
