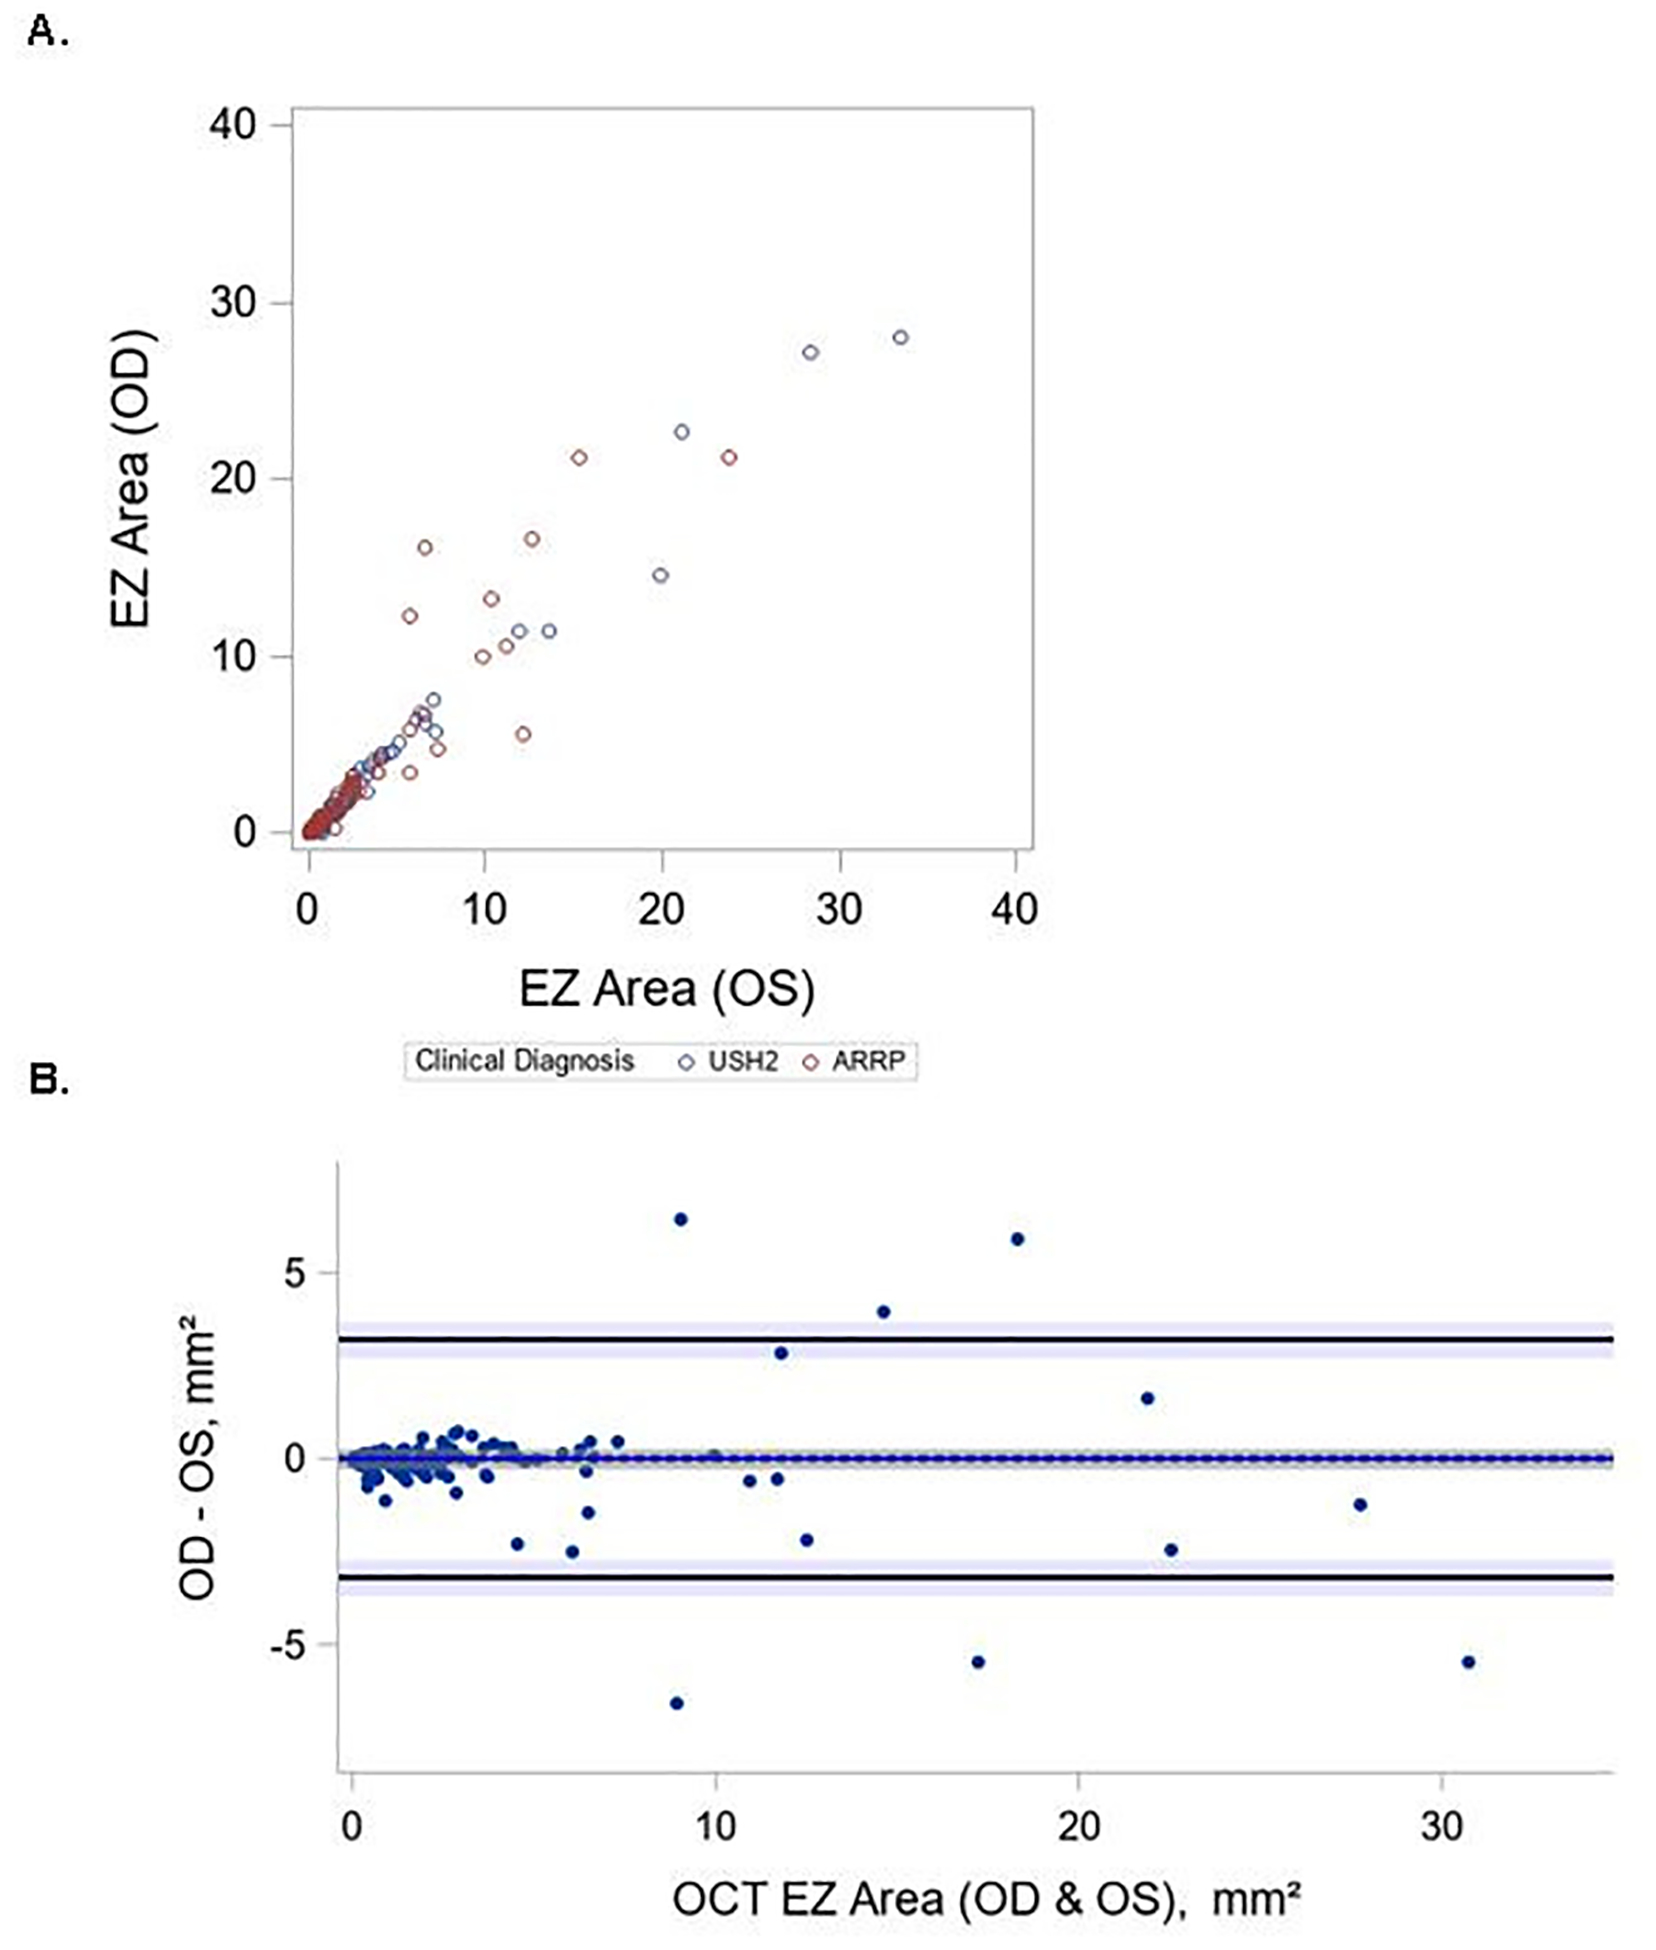
Figure 4 (A-B). Interocular variability and symmetry of OCT EZ area.

Bland-Altman plot of OCT EZ area measurements from the left and right eye of each participant. The difference in OCT EZ between left and right eyes for OCT EZ is plotted on the y-axis against their averages on the x-axis. ICC=0.96 with 95%CI (0.94, 0.97) A. Scatter plot of OCT EZ area measurements from left and right eye of each participant B. Bland-Altman plot of OCT EZ area measurements from left and right eye of each participant
