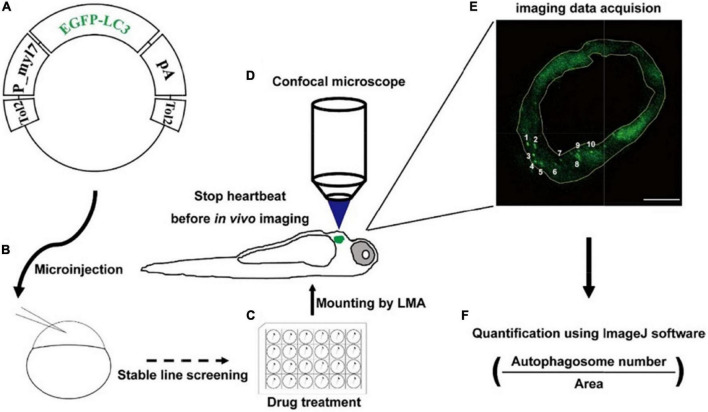
FIGURE 1.
Strategy of monitoring autophagic activity in zebrafish cardiomyocytes in situ. (A) The structure of transgenic plasmid for labeling autophagosomes. (B) Microinjection of the transgenic mixture into one-cell staged embryos for generating stable lines. (C) Drug treatment of zebrafish larvae using cell culture plates. (D) Transgenic larvae are mounted, stopped heartbeat, and then imaged under a confocal microscope. (E) Confocal image shows the EGFP-positive puncta that are characterized as autophagosomes. The area of heart tissue is selected by a yellow polygon using the ImageJ software. Arabic numerals show autophagosomes. Scale bar: 20 μm. (F) The density is calculated by dividing the number of autophagosomes by the area of heart tissue.

