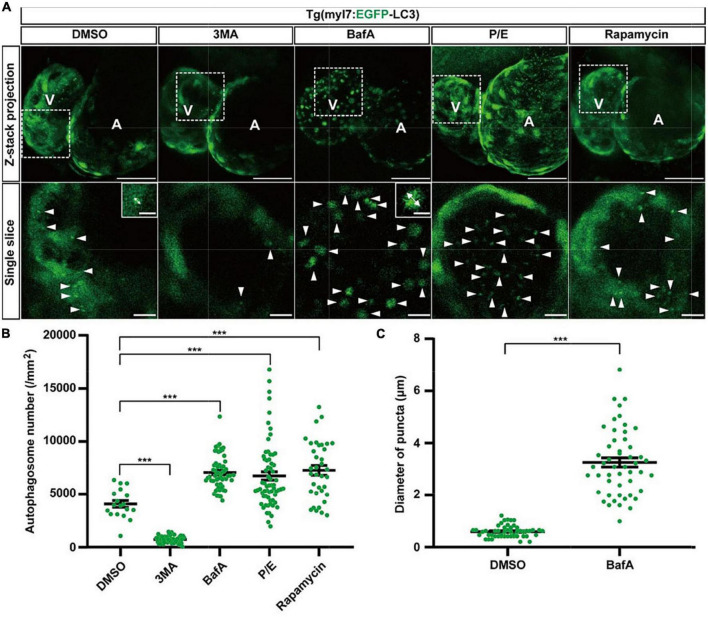
FIGURE 2.
The density of autophagosomes in zebrafish heart is regulated by known autophagy-modulating drugs. (A) Representative images of 3-dpf zebrafish heart of Tg(myl7:EGFP-LC3) line when treating with indicated drugs for 24 h. The top row shows the Z-stack maximum projections (scale bar: 50 μm), the bottom row shows the single slice (scale bar: 10 μm), inset in the bottom row shows the single punctum in indicated treated groups (scale bar: 3 μm). Arrowhead represents the autophagosome, double arrow line represents the diameter of the autophagosome. (B) Quantification of the density of autophagosomes in 3-dpf zebrafish heart of Tg(myl7:EGFP-LC3) line when treating with indicated drugs for 24 h. The data are shown as mean ± s.e.m for each group. n = 18 in control group, n = 55 in 3MA group, n = 58 in BafA group, n = 65 in P/E group, and n = 36 in Rapamycin group. (C) Quantification of the diameter of puncta in 3-dpf zebrafish heart when treated with BafA compared with the control group. n = 50 in the control group, and n = 50 in the BafA group. ***p < 0.001. A, atrium; V, ventricle.

