FIGURE 4.
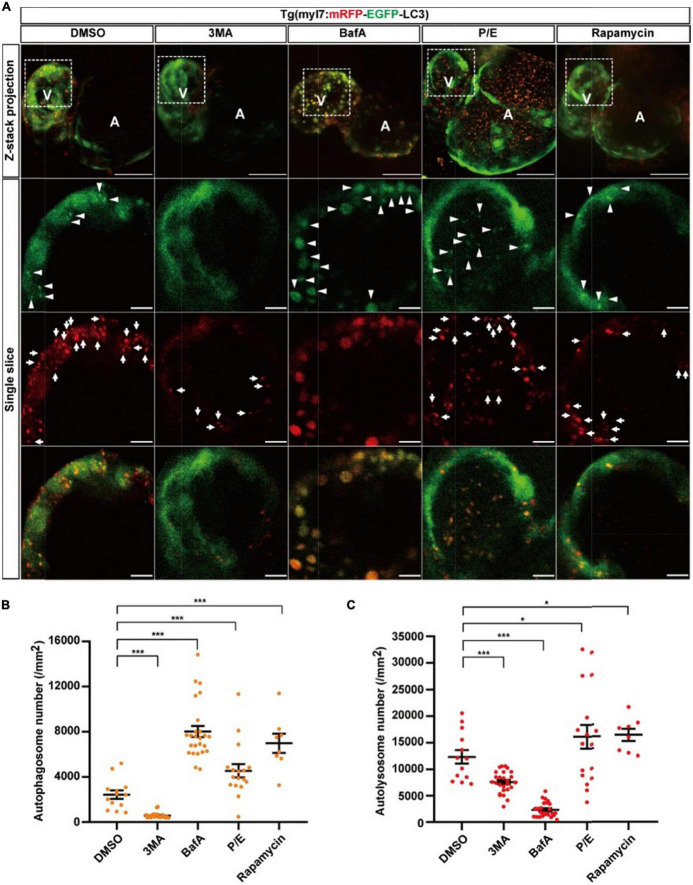
The densities of autophagosomes and autolysosomes in zebrafish cardiomyocytes are regulated by known autophagy-modulating drugs. (A) Representative images of 3-dpf zebrafish heart of Tg(myl7:mRFP-EGFP-LC3) line when treated with indicated drugs for 24 h. The top row shows the Z-stack maximum projections with merged EGFP and mRFP signals (scale bar: 50 μm), the second row shows the single slice with EGFP signal, the third row shows the single slice with mRFP signal, and the bottom row shows the single slice with merged EGFP and mRFP signals (scale bar: 10 μm). Arrowhead represents autophagosome, the arrow represents autolysosome. (B) Quantification of the density of autophagosomes in 3-dpf zebrafish heart of Tg(myl7:mRFP-EGFP-LC3) line when treated with indicated drugs for 24 h. (C) Quantification of the density of autolysosomes in 3-dpf zebrafish heart of Tg(myl7:mRFP-EGFP-LC3) line when treated with indicated drugs for 24 h. The data are shown as mean ± s.e.m for each group. n = 13 in control group, n = 26 in 3MA group, n = 25 in BafA group, n = 17 in P/E group, and n = 8 in Rapamycin group. *p < 0.05, ***p < 0.001. A, atrium; V, ventricle.

