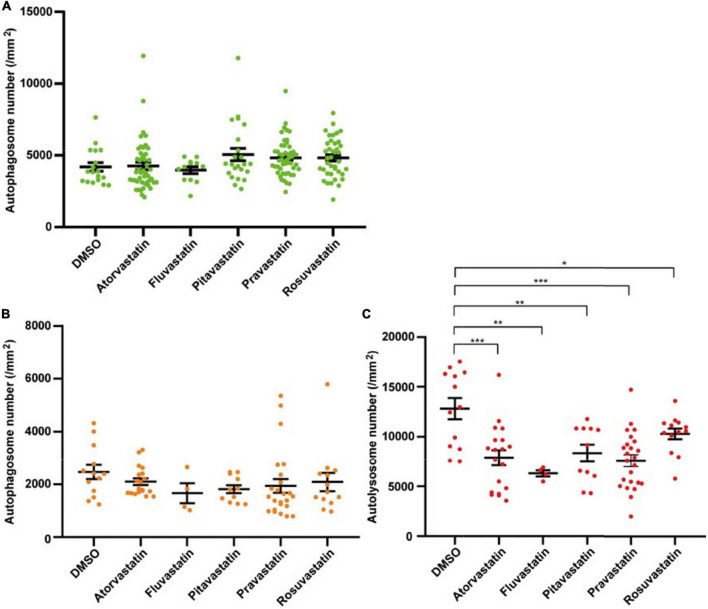
FIGURE 6.
The densities of autophagosomes and autolysosomes in zebrafish cardiomyocytes are quantified when treated with statins. (A) Quantification of the density of autophagosomes in 3-dpf zebrafish heart of Tg(myl7:EGFP-LC3) line when treated with indicated statins. (B) Quantification of the densities of autophagosomes in 3-dpf zebrafish heart of Tg(myl7:mRFP-EGFP-LC3) line when treated with indicated statins. (C) Quantification of the densities of autolysosomes in 3-dpf zebrafish heart of Tg(myl7:mRFP-EGFP-LC3) line when treated with indicated statins. The data are shown as mean ± s.e.m for each group. n = 13 in the control group, n = 19 in the atorvastatin group, n = 4 in the fluvastatin group, n = 11 in pitavastatin, n = 24 in the pravastatin group, and n = 13 in the rosuvastatin group. *p < 0.05, **p < 0.01, ***p < 0.001.

