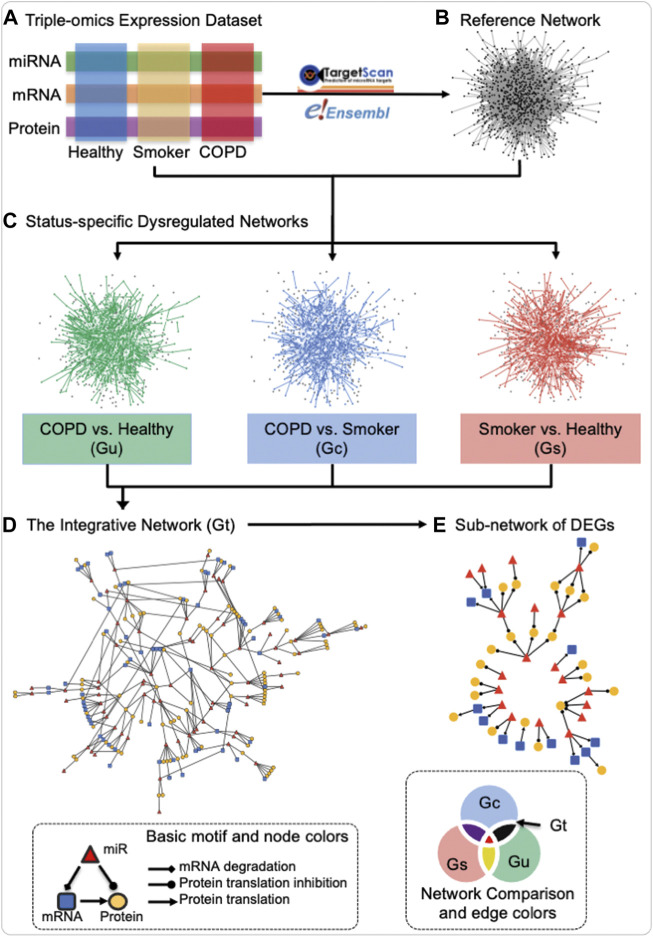
FIGURE 1.
Schematic of the construction of the miRNA–mRNA–protein dysregulation network. Three data modalities (miRNA, mRNA, and protein) from the three groups of healthy never-smokers (healthy), current-smokers with mild-to-moderate COPD (COPD), and smokers with normal lung function (smokers) (A) were utilized for the construction of a reference network by mapping miRNA to mRNA regulation and mRNA to protein translation in TargetScan and Ensembl databases (B), resulting in the union of three-node basic motifs (bottom left inset). Status-specific dysregulated networks from each contrast of interest were then extracted from differentially co-expressed interactions in each status comparison (C) An integrative dysregulated network (D) was then constructed using the network set operation illustrated in “Network Comparison” (bottom right inset), where Gt (black) represents the main contrast of interest for this investigation, namely, the difference between the “status-specific dysregulated networks” in “COPD vs. healthy” (Gu) and “smoker vs. healthy” (Gs), when intersected with the network of “COPD vs. smokers” (Gc). Finally, sub-networks containing differentially expressed genes (DEGs) were extracted for further investigation (E) In “Basic motif and node colors,” the node and edge shapes applied to all panels and the node colors used that of panel d and (E) In “Network Comparison and edge colors,” the colors for different networks corresponded to both edge and node in panel (C) The edge and node colors are grey and black in Reference Network of panel (B) Created using igraph in R and Cytoscape.

