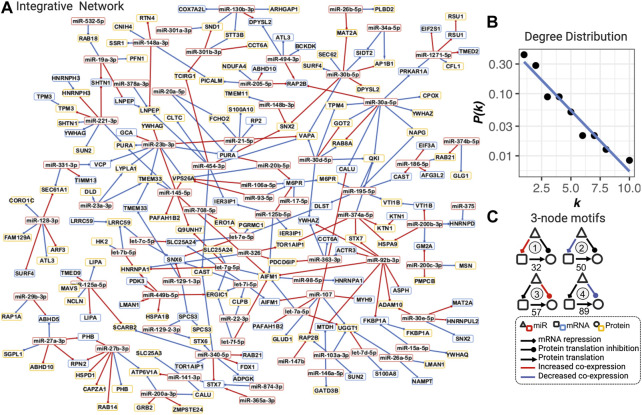
FIGURE 2.
Integrative dysregulated network (A), its degree distribution (B), and three-node motifs and their counts (C). (A) Integrative dysregulated network is a directed network from miRNA to mRNA, mRNA to protein, or from miRNA to protein (see legend inset, bottom right). Nodes with red, blue, and yellow borders represent miRNA, mRNA, and protein, respectively. Red and blue edges mean increased or decreased co-expression between COPD and smokers, respectively. The full network with the dynamic layout and searchable gene names and functions in the HTML format is available at https://chuanxingli.github.io/pages/Sharing/FigS3.html and in Supplementary Figure S3. (B) Power-law degree distribution with the linear regression of degree (k) ∼ the probability of degree (P(k) in log10 scale) of linear regression R-squared = 0.943, p-value = 8.19*10–6. (C) Four major types of three-node motifs and their counts in the integrative network. Motifs 1 and 2 mean miRNAs significantly (FDR<=0.2) increased or decreased the regulation of mRNA transcription repression in COPD vs. smoker, respectively. Motifs 3 and 4 mean miRNAs significantly (FDR ≤0.2) increased or decreased the regulation of protein expression (potential protein translation inhibition) in COPD vs. smoker, respectively. The number under the motif is their count in the integrative regulated network. Created using igraph and Cytoscape. The full names of genes are provided in Supplementary Table S2.

