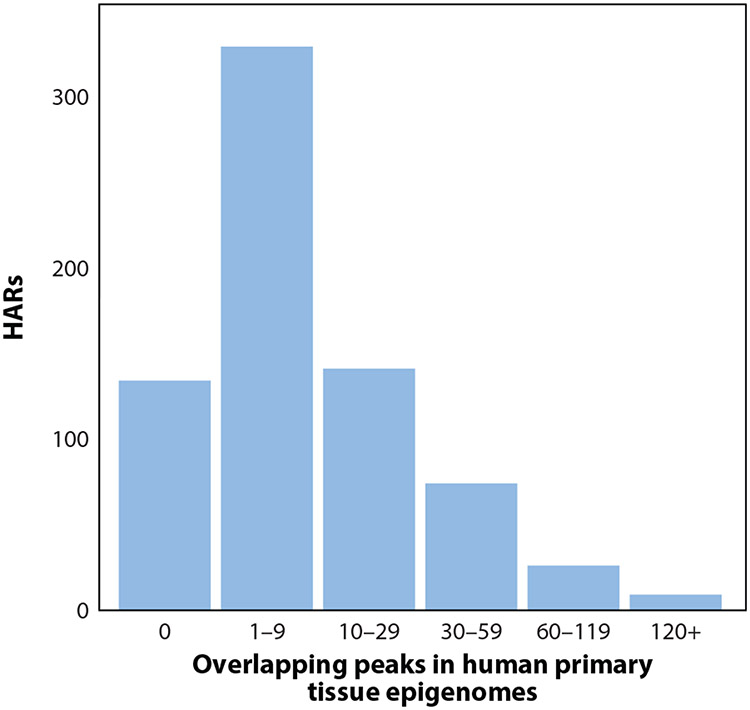
Figure 2.
Human accelerated regions (HARs) are marked with dozens of epigenetic features. This histogram shows the number of epigenetic marks overlapping HARs (71). Less than 20% of HARs (134/713) overlap no peaks, and the top 10% of HARs overlap more than 40 peaks each. This analysis focuses on 5% irreproducible discovery rate peak calls from primary tissues. Including peaks from cell lines and/or less conservative peak calls would increase the number of overlaps.

