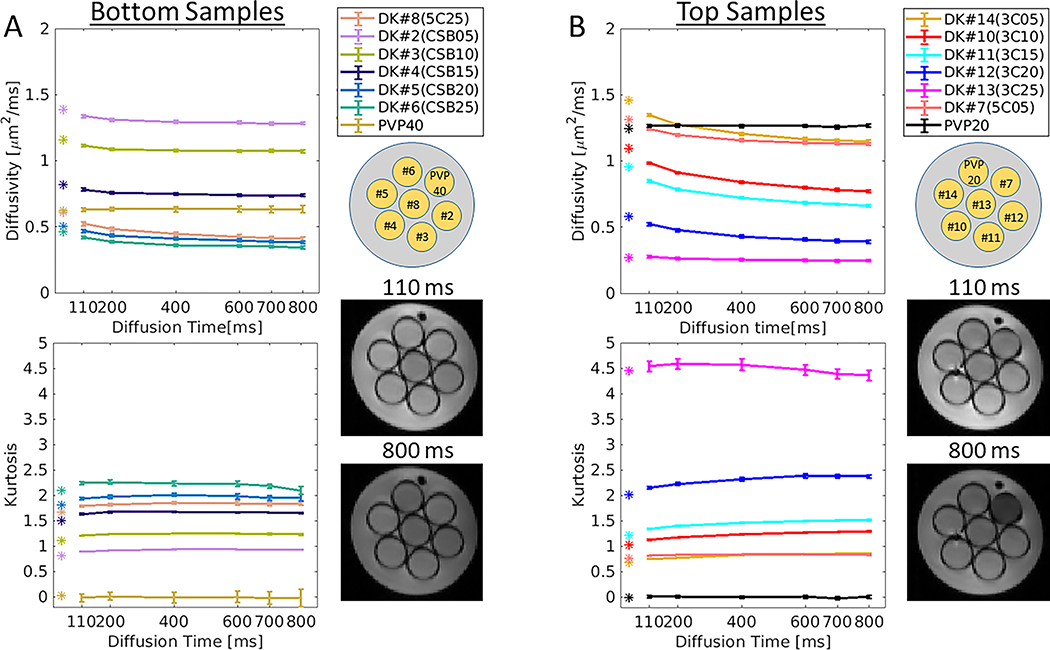
Figure 3.
Diffusivity and kurtosis measurements of the diffusional kurtosis phantom. The phantom is composed of two clusters of samples: (A) bottom and (B) top, each composed of combinations of different chemical compositions (see Methods section). Time-dependent experiments included multiple diffusion times [Δ =110, 200, 400, 600, 700, 800 ms] with same b-values up to 2500 per diffusion time. Bottom and top clusters are characterized by their coded samples and their corresponding STEAM-EPI b0 images at 110 ms and 800 ms diffusion time. Measured SE-EPI diffusivity and kurtosis values are indicated by colored asterisks.

