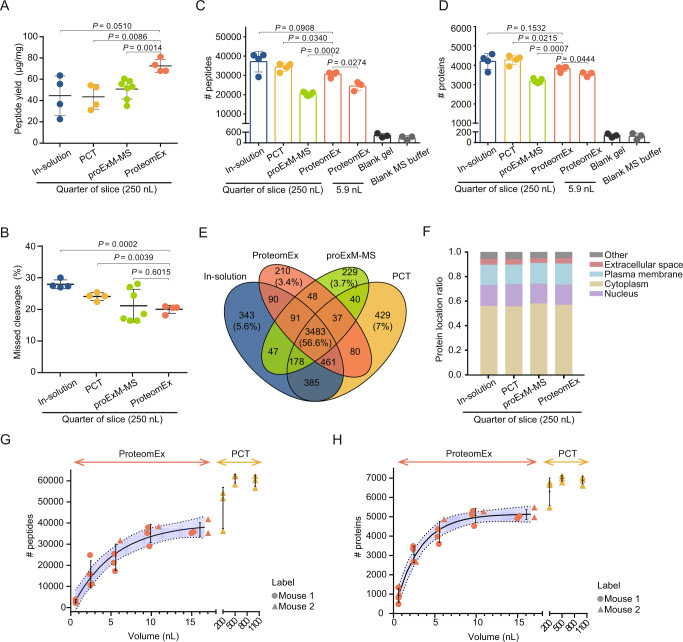
Fig. 2. ProteomEx benchmarking.
A The peptide yields of the in-solution, PCT, proExM-MS, and ProteomEx methods applied to the mouse brain tissue (n = 4, 4, 7, 4 biologically independent samples from one, one, two, and one brain slices, respectively, the same samples were used to acquire data shown in panels A–F; dot, individual data point, bar, mean, whiskers, standard deviation (SD), throughout Fig. 2; P-values are estimated by Welch’s t-test (two-sided). Data are presented as mean values ± SD.). B Missed cleavages of the identified peptides prepared using in-solution, PCT, proExM-MS, and ProteomEx methods. Data are presented as mean values ± SD. Number of peptide (C) and protein (D) identifications in seven sample groups (n = 3 and 3 punches from one slice from one mouse for ProteomEx (5.9 nL) and blank hydrogel, n = 3 independent injections for MS buffer; analyzed by DDA). Data are presented as mean values ± SD. E Venn diagram of identified proteins for the bulk samples shown in D. F The subcellular locations of the identified proteins for the samples shown in E. Number of peptide (G) and protein (H) identifications for different tissue volumes processed by ProteomEx and PCT (n = 4 punches per group from 2 mice for ProteomEx, LEF = 6.3, 6.2, 6.3, 5.9; n = 3 tissue dissections per group from 1 mouse for PCT; dot and triangle, individual data point; center of error bar ends, mean; whiskers, SD; solid line, four-parameter logistic fit, dashed line indicates 95% confidence interval border, shaded area represents 95% confidence interval; analyzed by PulseDIA; dot, individual data point; bar, mean; whiskers, SD). Source data are provided as a Source Data file.

