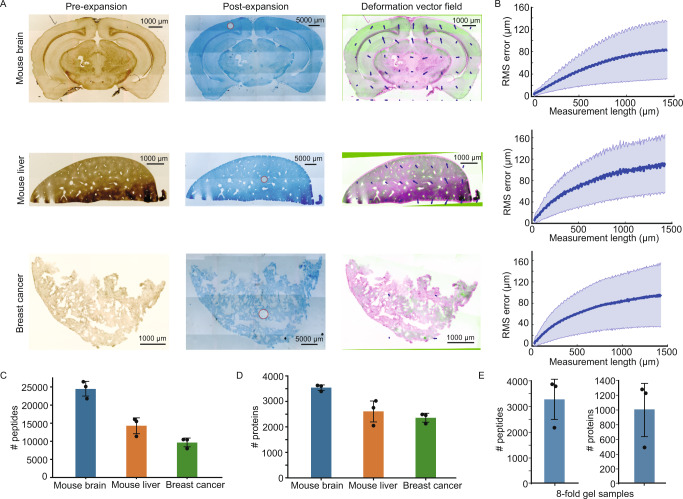
Fig. 3. Validation of ProteomEx in different tissue types.
A Representative bright-field images of different tissue slices pre-expansion (left column) and post-expansion (middle column; Coomassie-stained) and overlay (right column) of pre-expansion image (green pseudo-color) and registered post-expansion image (magenta pseudo-color). Arrows represent the deformation vector field (n = 3, 3, and 3 tissue slices from one mouse each; in the images of the expanded sample white circles represent the dissected area for peptide analysis shown in C. B The root-mean-square (RMS) measurement length error for pre- versus post- expansion brain slice images for the experiments shown in A (n = 3, 3, and 3 tissue slices from one mouse each; average LEF = 5.8, 6.5, and 6.2 for brain, liver, and tumor respectively; blue line, mean; shaded area, standard deviation (SD)). Number of peptide (C) and protein (D) identifications (n = 3, 3, and 3 punches for each tissue from one mouse each; 5.6 nL tissues were punched out and analyzed by DDA; dot, individual data point, bar, mean, whiskers, SD). Data are presented as mean values ± SD. E Number of peptide and protein identifications for 0.37 nL brain tissue analyzed in PulseDIA mode (n = 3 punches from one slice; dot, individual data point, bar, mean, whiskers, SD). Data are presented as mean values ± SD. Source data are provided as a Source Data file.

