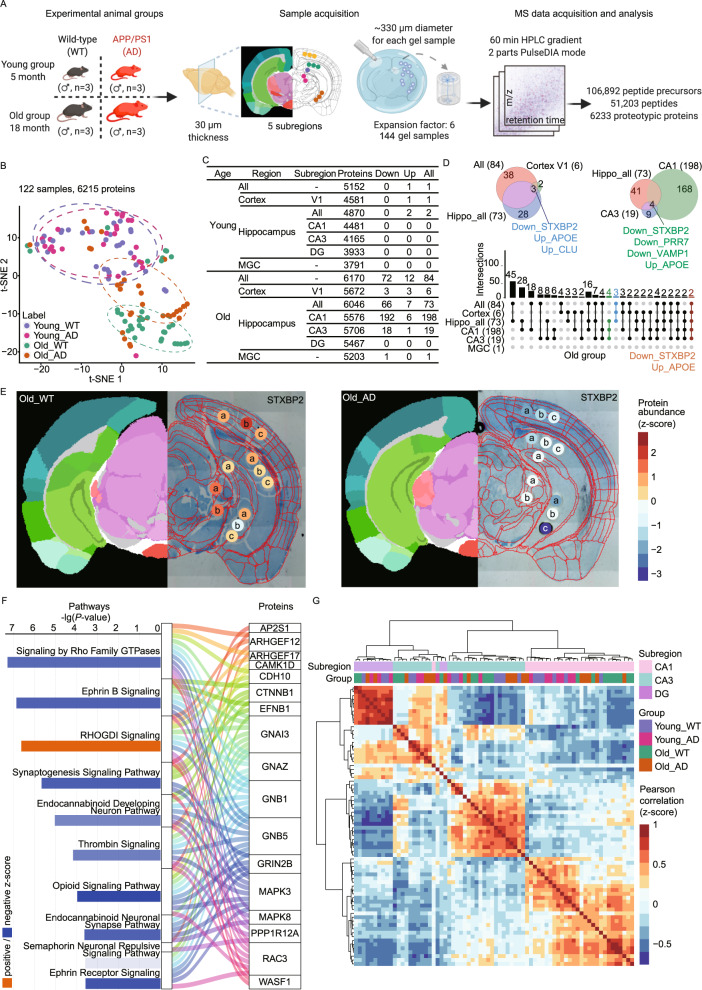
Fig. 4. ProteomEx applied to AD mouse brains.
A Study design of proteomic analysis of the wild-type and AD mouse model representing (1) experimental animal groups (n = 3 mice per group), (2) sample acquisition, (3) MS data acquisition and analysis. Brain subregions selected namely, primary visual cortex (V1, n = 3 punches per slice per mouse), hippocampal field CA1 (CA1, n = 3 punches per slice per mouse), hippocampal field CA3 (CA3, n = 3 punches per slice from per mouse), dentate gyrus (DG, n = 1 punch per slice per mouse), and medial geniculate complex (MGC, n = 2 punches per slice per mouse). Created with Biorender.com. B t-SNE plot showing the sample clusters based on the prototype (n = 3 mice per group). C Number of differentially expressed proteins in mouse brain. D Venn and upset diagrams showing the DEP overlaps for selected regions. E Representative spatial proteomic maps of syntaxin binding protein 2 (STXBP2) in old WT (left) and old AD (right) brain slices (the left half shows the color annotation of mouse brain structures, the right half is a bright-field image of Coomassie-stained expended brain tissue overlaid with punched locations, circles, and automatically registered atlas diagram of anatomical structures, red lines; LEFs were 5.9 ± 0.2 and 5.8 ± 0.2 for WT and AD, respectively; n = 6 and 6 slices from 6 WT and 6 AD mice, respectively). The color bar represents the z-score normalized protein abundance for the punches. The a/b/c in the punches represents biological replicates from the same brain region. F Pathway enrichment of 192 DEPs in CA1 and Sanky plot exhibiting the correlation between enriched pathways and proteins (P-values were calculated by the right-tailed Fisher’s exact test based on the IPA database). G The hierarchical clustering heatmap showing the z-score scaled Pearson correlation coefficients between two samples labeled by subregions of hippocampus and mouse group. The Pearson correlation coefficients were estimated by the abundance expression of 101 proteins. Source data are provided as a Source Data file.

