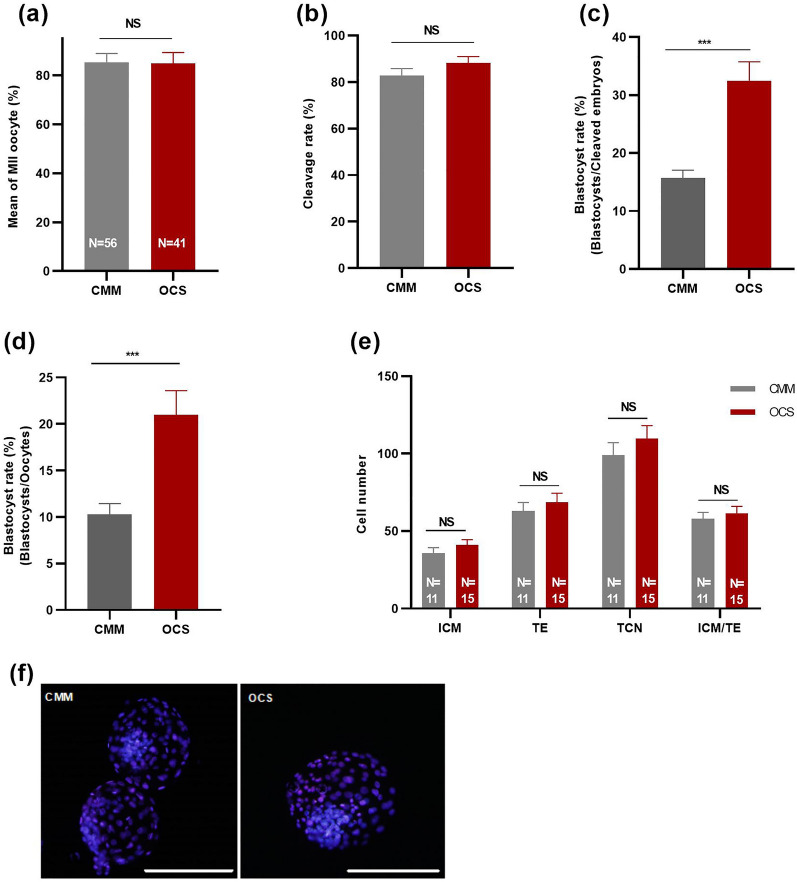
Figure 3.
Effect of one carbon supplementation on (a) MII oocyte rate, (b) Cleavage rate, (c) Blastocyst rate (Blastocyst/Cleaved embryos), (d) Blastocyst rate (Blastocyst/Oocytes) and (e) Embryo cell number. (f) Representative images from differential staining of blastocysts of CMM and OCS groups. Magnification 20 ×; Scale bar, 100 µm. ICM inner cell mass, TE trophectoderm cells, TCN total cell number. The data are shown as mean ± s.e.m. NS stands for non-significant differences (P > 0.05). ***stands for P ≤ 0.001. N stands for number of total oocytes or blastocysts in each group. For embryonic development 12 replications, consisting of 700 oocytes, were done for each group.

