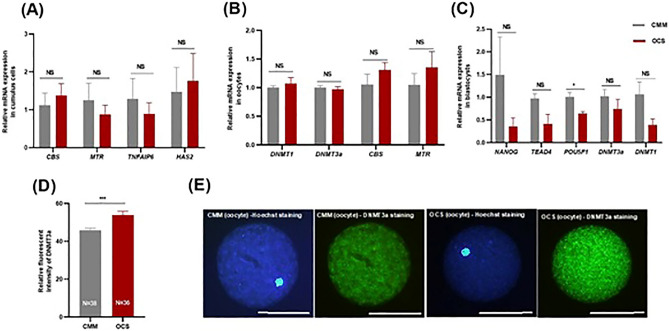
Figure 7.
Effect of one carbon supplementation on relative mRNA expression of target genes in (A) cumulus cells, (B) matured oocytes and (C) blastocysts. (D) Effect of one carbon supplementation on DNMT3a protein expression in terms of fluorescent intensity in matured oocytes. (E) Representative images of DNMT3a immunocytochemistry in matured oocytes (20 × magnification; Scale bar, 100 µm). The data are shown as mean ± s.e.m. NS stands for non-significant differences (P > 0.05). *Stands for P < 0.05. ***Stands for P ≤ 0.001. N stands for total number of oocytes in each group.

