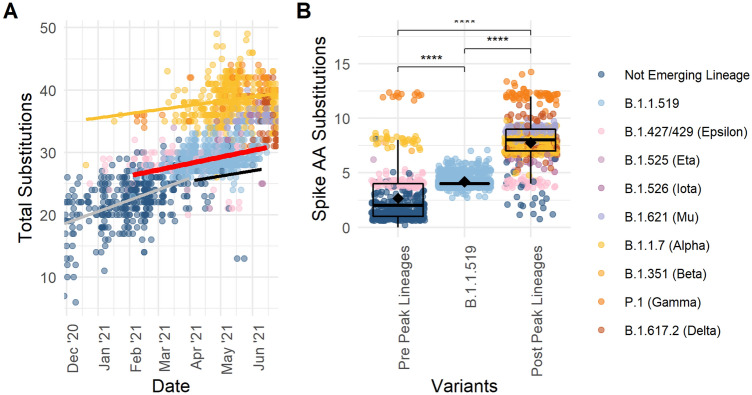
Figure 3.
Amino acid substitutions in SARS-CoV-2 genomes from Alaska. Scatterplots depicting the (A) total AA substitutions over time. Data includes each genome from an Alaskan confirmed case, colored by variant. The lines show a generalized linear model regression of not emerging lineage cases before 2021-04-04 (gray), after 2021-04-04 (black), Alpha (yellow), and B.1.1.519 (red). (B) Boxplot of number of S protein AA substitutions per genome from sequences pre-peak prevalence of B.1.1.519 on 2021–04-04, B.1.1.519, and post peak prevalence genomes. Diamonds depict the mean number of AA substitutions. Points are individual genomes colored by lineage. Wilcoxon test between group significance p < 0.0001 ****, p < 0.05 *, ns > 0.1.

