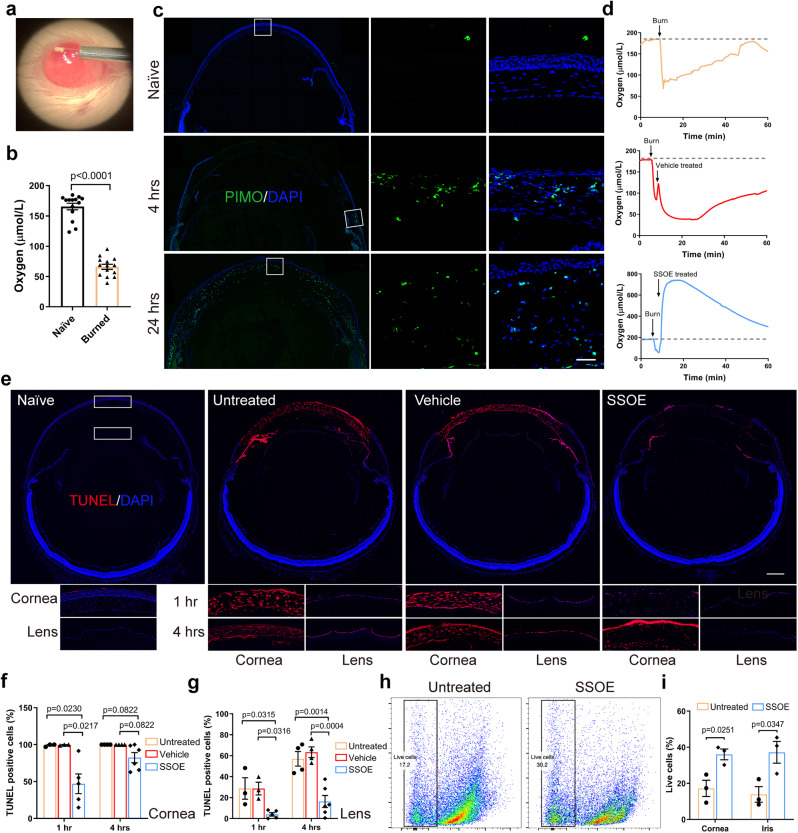
Fig. 6. SSOE reduces ocular tissue hypoxia and cell death after alkali burn.
a Oxygen concentration in anterior chamber (AC) was recorded in real time by inserting a micro-oxygen sensor. b AC oxygen level decreased by 60% immediately after alkali burn. Data are presented as mean ± SEM. Statistical significance was determined using unpaired, two-tailed Student’s t test. n = 14 eyes in each group. c Pimonidazole hydrochloride (PIMO) staining, a chemical hypoxia marker, showed limbal staining at 4 h post burn and diffuse staining in the entire cornea by 24 h (inserts showed higher magnification of selected areas in white boxes, scale bar 10 μm). Data are representative of three independent experiments. d In untreated and vehicle-treated eyes, AC oxygen concentration decreased rapidly after burn and gradually increased within one hour. SSOE raised AC oxygen concentration to supra-physiologic level after burn and maintained high levels for more than 60 min. Dashed line represents baseline AC oxygen concentration. e Whole mouse globe was cryo-sectioned and TUNEL (red) staining highlighted dead cells in the eye at 1 h after alkali burn in untreated and vehicle groups. SSOE treatment reduces the extent of cell death. Lower panels show higher magnification of the central cornea and anterior lens capsule at 1- and 4 h post burn (scale bar 0.3 mm). The percentage of TUNEL-positive cells in the cornea (f) and lens epithelium (g) was lower in SSOE group. Data are presented as mean ± SEM. 1 h timepoint: n = 3, 3, 5 eyes in untreated, vehicle and SSOE-treated groups, respectively; 4 h: n = 4, 4, 6 eyes in untreated, vehicle and SSOE-treated groups, respectively. Statistical significance was determined using one-way ANOVA with Tukey’s multiple comparisons test (two-sided). h The percentage of live cells in the cornea 1 h post burn was determined by flow cytometry. i There were significantly more live cells in the cornea and iris of SSOE-treated eyes compared to untreated eyes. Data are presented as mean ± SEM. Statistical significance was determined using unpaired, two-tailed Student’s t test. n = 3 eyes in each group. Source data are provided as a Source Data file.

