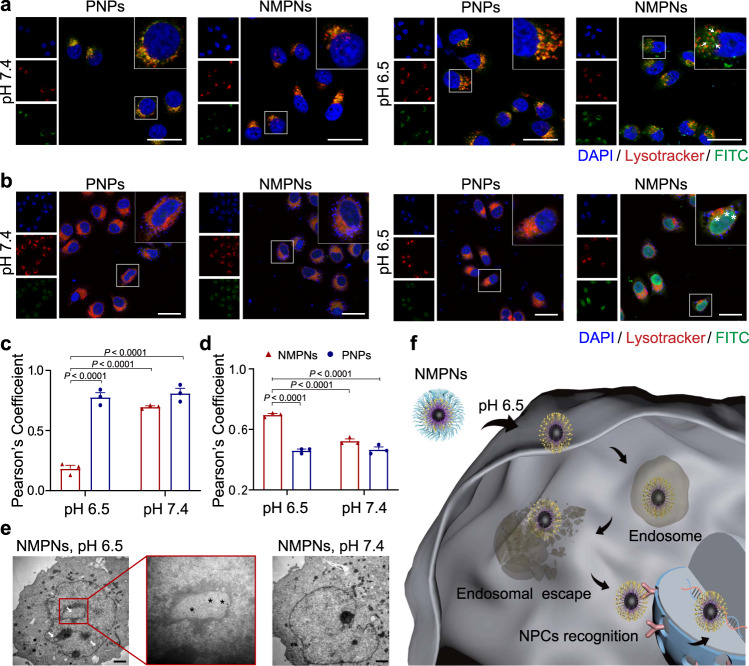
Fig. 3. pH-dependent cell nucleus-targeting of NMPNs.
a CLSM images of intracellular localization of FITC-labelled NMPNs and FITC-labelled PNPs after incubated for 6 h under different pH conditions. Scale bar: 20 μm. Arrows indicate NMPNs in the cytoplasm after the escape from endosomes in cisplatin-resistant Huh7 cells. b CLSM images of intracellular localization of FITC-labelled NMPNs and FITC-labelled PNPs after incubated for 12 h under different pH conditions. Scale bar: 40 μm. Asterisks indicate NMPNs in the nucleus of cisplatin-resistant Huh7 cells. c Quantitative analysis of the colocalization between lysotracker and FITC-labelled NMPNs or PNPs. d Quantitative analysis of the colocalization between DAPI and FITC-labelled NMPNs or PNPs. e Bio-TEM images of cells after incubation for 12 h with NMPNs under different pH conditions. Arrowheads indicate NMPNs accumulated in the nucleus of Huh7 cells. Black asterisks indicate NMPNs in nucleus. Scale bar: 1 μm. f Schematic diagram of the NMPNs to target the tumour cell nucleus. All data are presented as means ± SEM, n = 3 independent experiments. Statistical significance was analyzed by one-way ANOVA with multiple comparisons test (c, d). Source data are provided as a Source Data file.

