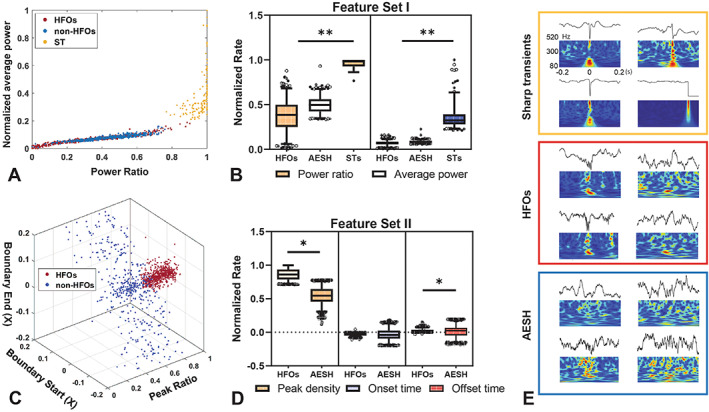
FIGURE 2.

HFO selection process. A, 2D distribution of three types of events based on power ratio and normalized power , with red, blue, and yellow dots representing HFOs, AESH, and sharp transients (ST), respectively. B, The statistical analysis of feature set one with respect to HFOs, AESH, and STs. C, 3D distribution of HFO and AESH regards to peak ratio, start/end time of POE. The red dots refer to HFOs, while blue dots represent AESH. D. The statistical analysis of feature set two with respect to HFOs and AESH. E. The demonstrative events of the ST (top), HFO (middle), and AESH (bottom).
