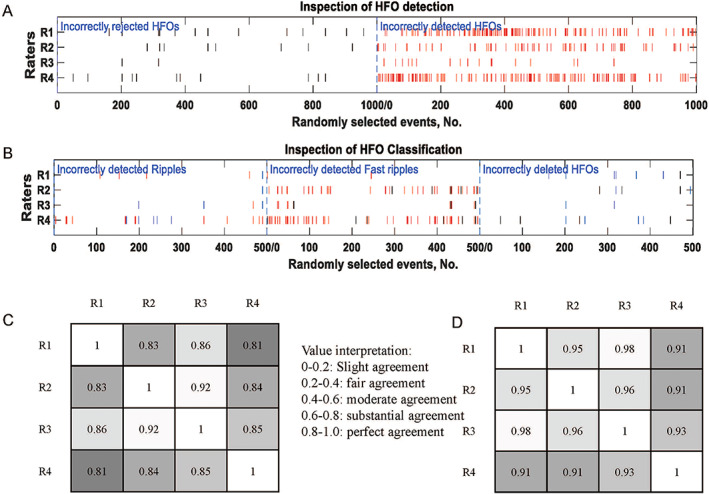
FIGURE 4.

Evaluation of our approach. A, Raster plot of HFO algorithm evaluation. The black bars referred to the disputes over HFO events rejected by detector and red bars referred to disagreements over the detected HFOs. B, Raster plot of HFO classification evaluation. Incorrectly detected ripples: Blue bar from fast ripple, red bar from AESH. Incorrectly detected fast ripples: Black bar from ripple, red bar from non‐HFO events. Incorrectly deleted HFOs: black bar from ripple, blue bar from fast ripple. C, Correlation matrix of HFO detection between four raters, the lighter color the stronger agreement, with the overall . D, Correlation matrix of HFO detection evaluation between four raters, the lighter color the stronger agreement, with the overall .
