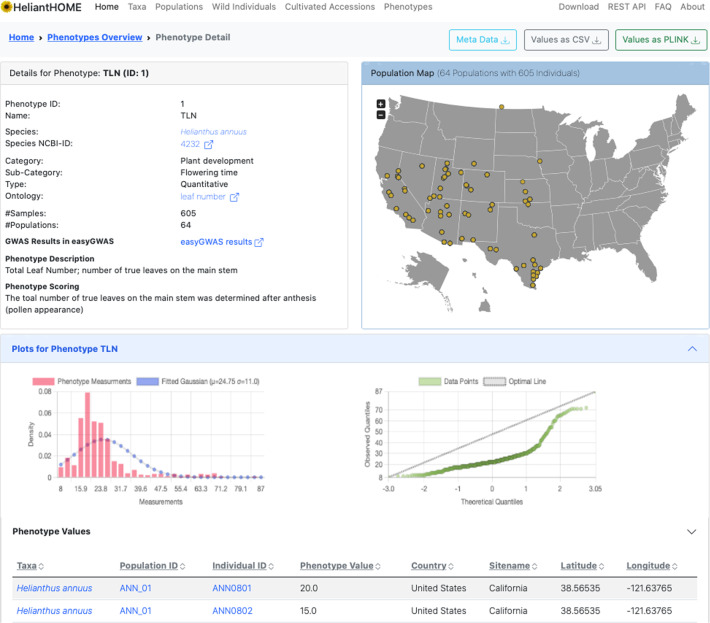
Fig. 4.
Phenotypes overview. Screenshot of the detailed view for a certain phenotype (http://www.helianthome.org/phenotype/1/). General information about the phenotype is shown in the left top corner of the screenshot. A detailed population map shows the distribution of samples for which we measured this phenotype within the US. Additional interactive plots are provided to investigate the phenotypic distribution. At the top right, different download options are provided to download the phenotypic values in different formats as well as all the available meta-information.

