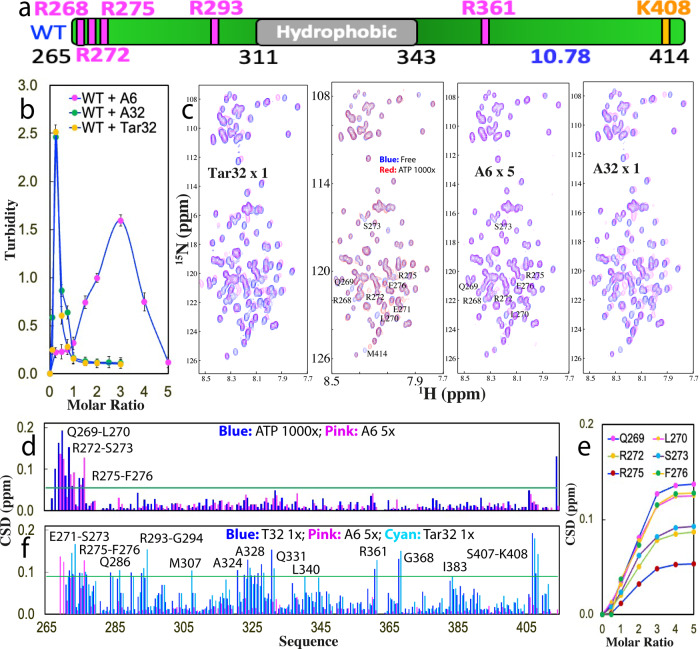
Fig. 1. Three ssDNAs length-dependently modulate LLPS of TDP-43 WT-PLD.
a Schematic representation of TDP-43 WT-PLD with five Arg and one Lys, as well as pI value indicated. b Turbidity curves from three repeated measurements (n = 3) of WT-PLD in the presence of Tar32, A6, and A32 at different molar ratios. c 1H–15N NMR HSQC spectra of the 15N-labeled WT-PLD in the absence (blue) and in the presence of ATP at a molar ratio of 1:1000 (red), as well as A6 at 1:5, A32 and Tar32, respectively, at 1:1 (purple). d Chemical shift difference (CSD) of WT-PLD between the free state and in the presence of ATP at 1:1000 (blue) or A6 at 1:5 (purple), respectively. The green line is used to indicate the value (0.05): Average + STD at the ratio of 1:5. The residues with CSD values > Average + SD are defined as significantly perturbed residues and labeled. e CSD tracings of six significantly perturbed residues in the presence of A6 at different ratios. f Chemical shift difference (CSD) of WT-PLD between the free state and in the presence A6 at 1:5 (purple), A32 at 1:1 (blue), and Tar32 at 1:1 (cyan), respectively. The green line is used to indicate the value (0.09): Average + STD in the presence of Tar32 at the ratio of 1:1 (PLD: Tar32). The residues with CSD values > Average + SD are defined as significantly perturbed residues and labeled.

