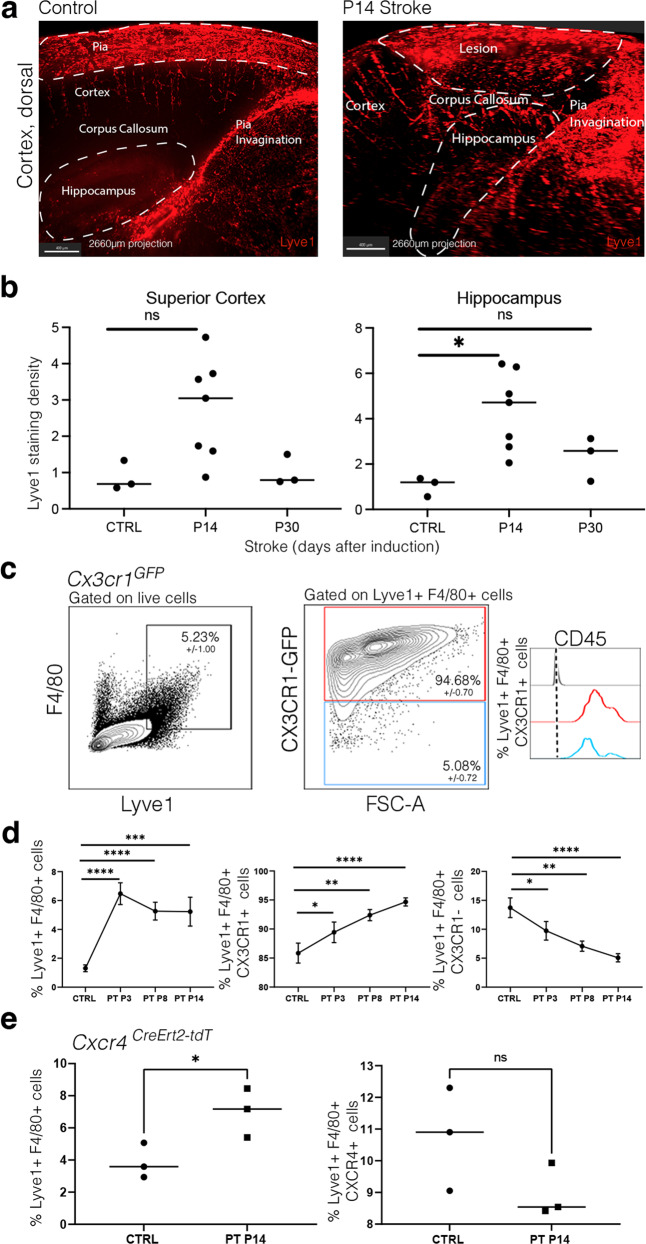
Fig. 7. CX3CR1+ pvM numbers increase after induced ischemic stroke.
a Maximal intensity projections (sagittal view) (2660 µm) of lightsheet acquisitions on cleared brains, stained for Lyve1 (red), control and after stroke (P14 = 14 days after induction of ischemic stroke) (2 individual experiments, n = 7 animals) (Supplementary Movies 5 and 6). b Quantification of Lyve1 in the area containing the whole stroke lesion within the dorsal cortex situated just above the hippocampus, imaged by lightsheet microscopy. * represents P-value ≤0.05 (Ordinary one-way Anova test). c Representative flow cytometry plots from Cx3cr1GFP brain parenchyma 14 days after induced stroke (P14), pre-gated on living, single and showing Lyve1+F4/80+ cells and CX3CR1+/CX3CR1– gating for these cells Lyve1+ F4/80+ and subsequently in blue the CD45 expression of the Lyve1+F4/80+CX3CR1–, in red the CD45 expression of the Lyve1+F4/80+CX3CR1+ and FMO in gray. Microglia cells were excluded since they are Lyve1–. Average percentages for the different subpopulations are shown in the plots (n = 4). d Graphs representing the Lyve1+F4/80+ cell % and Lyve1+F4/80+CX3CR1+ cell % showing an increase of these populations at P3, P8, and P14 after stroke by flow cytometry and Lyve1+F4/80+CX3CR1– cell % showing a decrease of this population at P3, P8, and P14 after stroke. Data are presented as mean value ± SD. Asterisk (*) represents P-value ≤0.05, **P-value ≤0.01, ***P-value ≤0.001, and ****P-value ≤0.0001 (unpaired t-test). e Graphs representing the Lyve1+F4/80+ cell % and Lyve1+F4/80+CXCR4+ cell % showing an increase of the first population at P14 after stroke by flow cytometry. Asterisk (*) represents P-value ≤0.05 (unpaired t-test). Source data are provided as a Source Data file.

