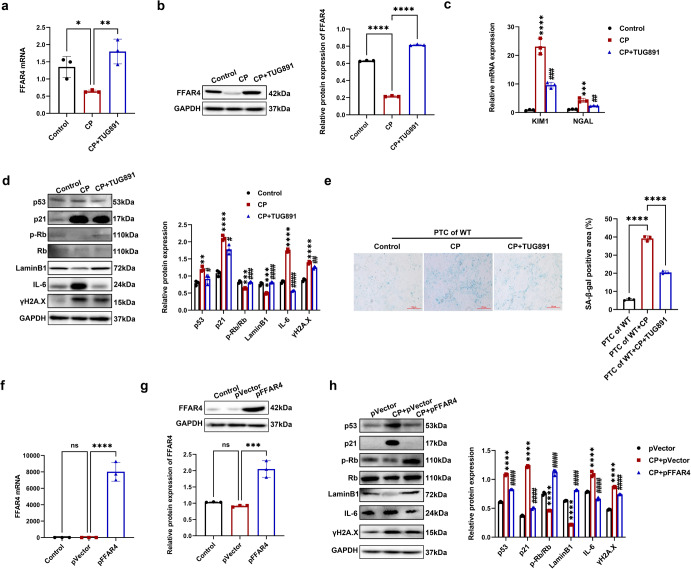
Fig. 5.
Activation of FFAR4 improved cellular senescence in cisplatin-stimulated renal tubular epithelial cells. a, b Relative mRNA and protein expression of FFAR4 in TCMK-1 cells (n = 3; ****P < 0.0001, **P < 0.01, *P < 0.05). c Relative mRNA expression of KIM1 and NGAL in TCMK-1 cells (n = 3; ****P < 0.0001, ***P < 0.001, CP vs. Control; ###P < 0.001, ##P < 0.01, CP + TUG891 vs. CP). d Protein expression of p53, p21, p-Rb/Rb, LaminB1, ɣH2A.X and IL-6 in TCMK-1 cells detected by western blotting and quantified by densitometry (n = 3; ****P < 0.0001, ***P < 0.001, **P < 0.01, CP vs. Control; ####P < 0.0001, ###P < 0.001, ##P < 0.01, #P < 0.5, CP + TUG891 vs. CP). e Representative images and quantitative analysis of the SA-β-gal staining of renal primary tubular cells (PTCs) from WT mice (100×, scale bar = 250 μm; n = 3; ****P < 0.0001). f, g Relative mRNA and protein expression of FFAR4 in TCMK-1 cells transfected with empty plasmid (pVector) or plasmid expressing FFAR4 (pFFAR4) (n = 3; ***P < 0.001, ****P < 0.0001, ns no significant). h Protein expression of p53, p21, LaminB1, p-Rb/Rb, ɣH2A.X and IL-6 in TCMK-1 cells transfected with pFFAR4 detected by western blotting and quantified by densitometry (n = 3; ****P < 0.0001, CP + pVector vs. pVector; ####P < 0.0001, CP + pFFAR4 vs. CP + pVector). Data are presented as mean ± SD. CP cisplatin

