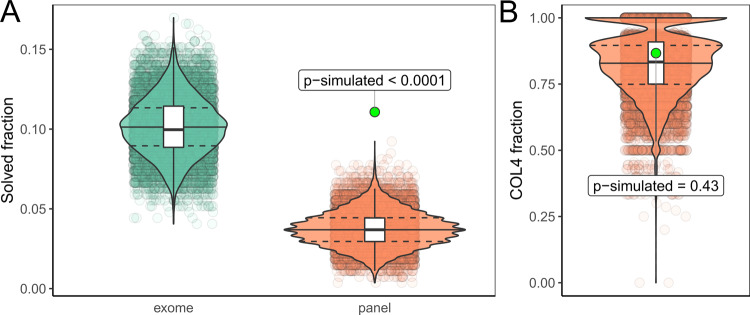
Fig. 4. Diagnostic yield in panel and exome.
A Violin and scatter plots of 10.000 simulations randomly drawing 271 individuals from the 3315 individuals reported by Groopman et al. and subset whether the reported variants would be detectable by exome (green) or our targeted panel (red). Estimated p value for the yield in our cohort (green dot) <0.0001. To exclude differences in variant classification between the two studies, we classified both our and all variants from the Groopman study using two automated ACMG classifiers which excluded all variants not classified as (likely) pathogenic from both cohorts. This gave similar results to the first simulation and thus excluded systematic differences in manual variant classification causing our higher yield (compare Figure S1). B To exclude unexpected enrichment for COL4A3, COL4A4, and COL4A5 genes, we further compared the fraction of variants in these genes in these simulations which showed no significant difference (p-simulated ~0.43) to the fraction (26/30 ~ 86.7%) observed in our cohort. Therefore, one could consider the COL4A3/4/5 variants as background, which would leave five small variants in ADTKD genes in our cohort, representing an enrichment of ~5.1 fold when compared to the Groopman cohort (calculation: (5/271)/(12/3315)). Compare Figure S1 for automated classification results. Compare File S4 [21] for full simulation results.

