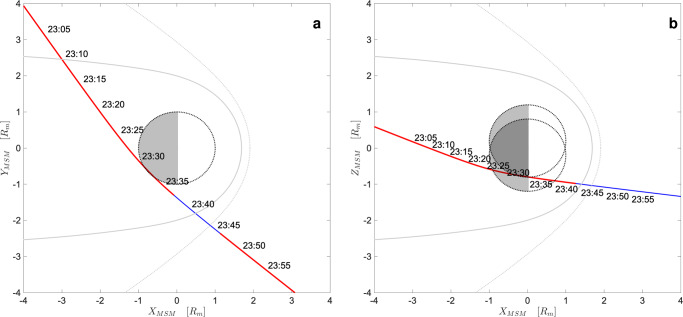
Fig. 1. Trajectory of BepiColombo during MFB1.
The trajectory of BepiColombo during the interval of interest, a in the XMSM-YMSM plane, b in the XMSM-ZMSM plane. The solid gray line represents the magnetopause surface, while the dashed gray line correspond to the bow shock surface. Red lines correspond to the operational time of PICAM and MIPA sensors. Time labels are shown progressively along the trajectory. BC position data are given in the Source Datas file.

