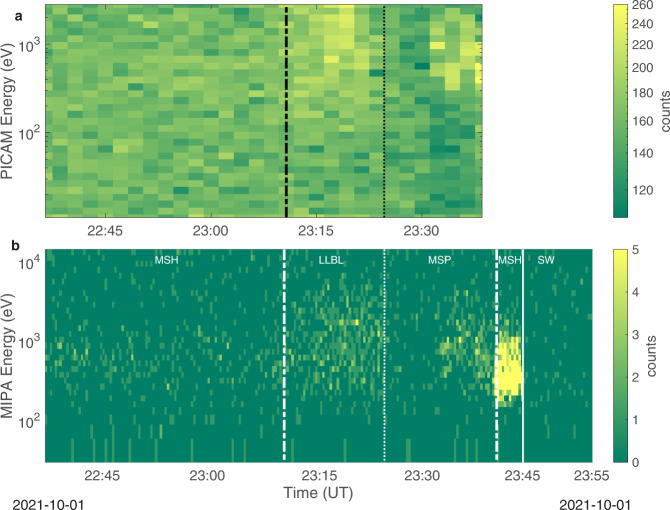
Fig. 5. MFB1 PICAM and MIPA spectrograms inside Mercury’s magnetosphere.
The spectrograms obtained by a PICAM observations and b MIPA measurements in the inner magnetosphere of Mercury. The dashed-dotted lines refer to the expected inbound and outbound magnetopause crossings, the dotted lines refer to the observed transition from low latitude boundary layer to the magnetospheric dusk lobe, while the solid line in b marks the bow shock crossing. Labels refer to the different regions crossed by the spacecraft, specifically: magnetosheath (MSH), low latitude boundary layer (LLBL), inner magnetosphere (MSP), and solar wind (SW). Color bars report ion counts in each specific time interval.

