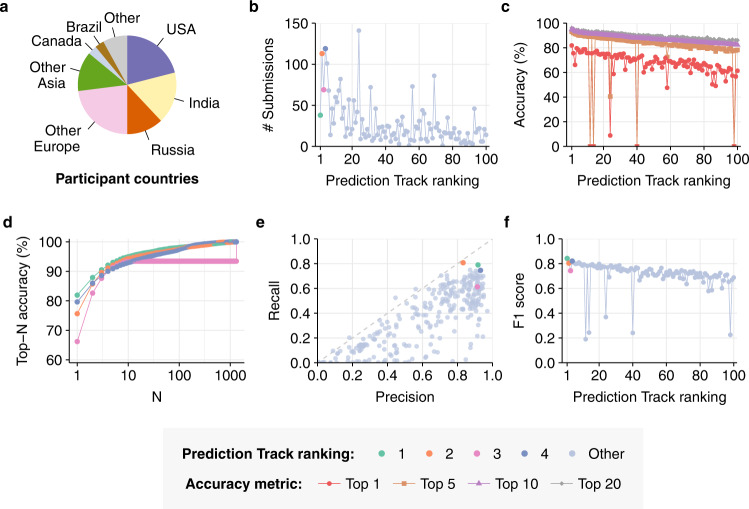
Fig. 2. Key Competition Results.
a Countries of residence of registered competition participants. b Total number of submissions made by the top 100 Prediction Track teams. c Top-1, −5, −10 and −20 accuracy achieved by each of the top 100 Prediction Track teams. Top-10 accuracy (purple) was used to determine overall ranking and prizes. In all cases, top-5 accuracy is equal to or greater than top-1 accuracy. d Top-N accuracy curves of the four prize-winning submissions to the Prediction Track, as a function of N. (e) Precision and recall of all 299 Prediction Track teams. Dashed grey line indicates x = y. f Macro-averaged F1 score achieved by each of the top 100 Prediction Track teams.

