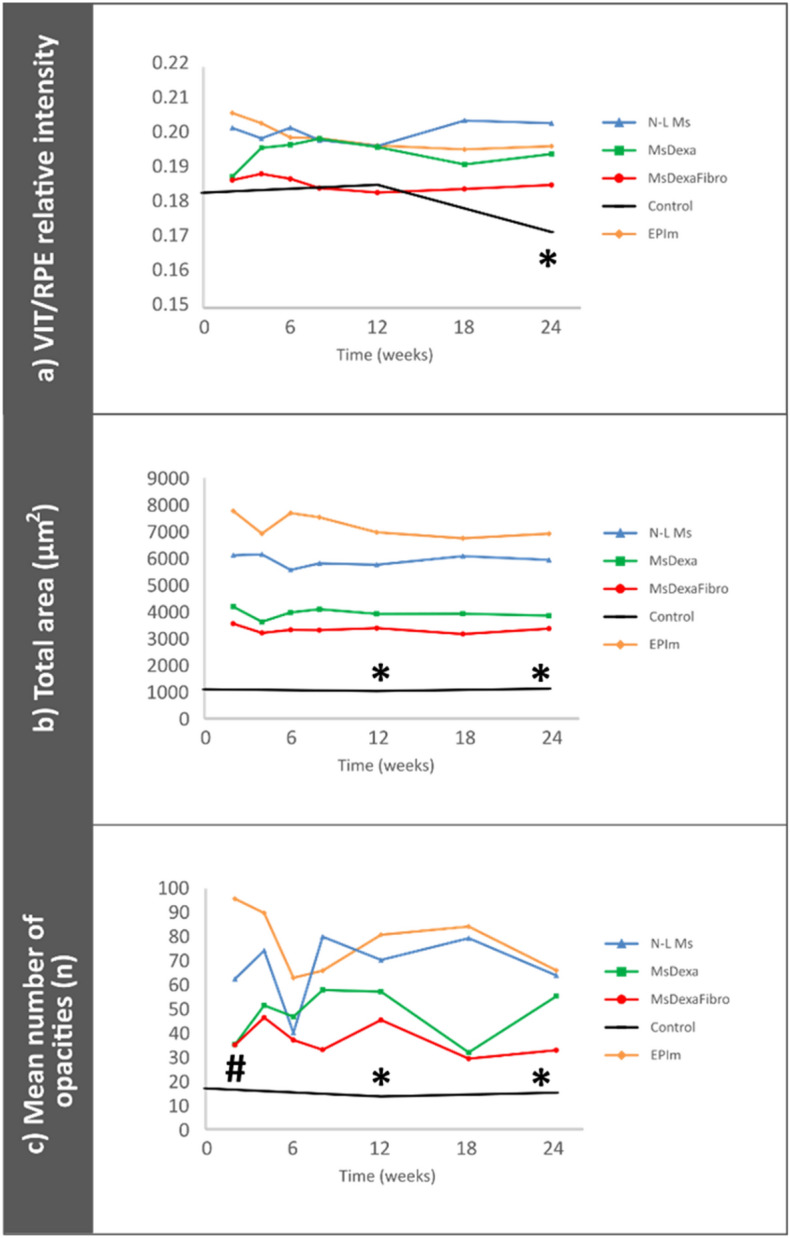
Figure 7.

Vitreous parainflammation measured using optical coherence tomography. (a): Vitreous/retinal pigmented epithelium relative signal intensity; (b): total area of opacities to show changes in total immune response; (c): mean number of opacities to quantify immune cells. N-L Ms cohort with non-loaded microspheres; MsDexa cohort with microspheres loaded with dexamethasone; MsDexaFibro cohort with microspheres loaded with dexamethasone and fibronectin; EPIm cohort with sclerosis of the episcleral veins. *: statistical significance (p < 0.05) between glaucoma models and healthy controls (ANOVA); #: statistical significance between the episcleral vein sclerosis model and each microsphere model by Scheffé test. Note that at later times, differences were found between EPIm and some of the microsphere models, (data not shown). Differences were only included when found between the EPIm model and each of the microsphere models. As can be seen, this occurred only at earlier times.
