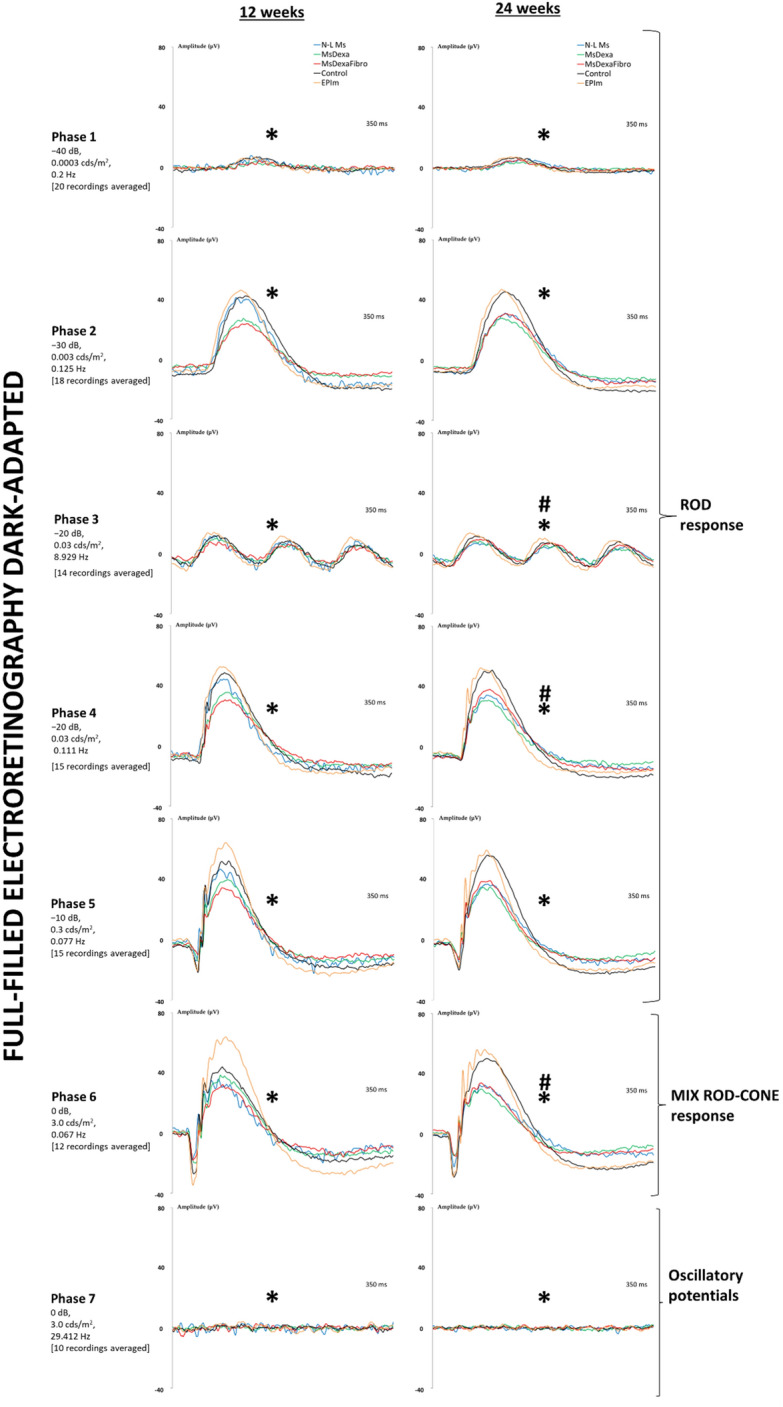
Figure 8.

Follow-up comparison of neuroretinal function using dark-adapted electroretinography between four chronic glaucoma models and healthy control cohorts. Full-field ERG test. μV microvolts; ms milliseconds; dB decibel; cds: candels; m2 square meter; Hz hertzio; N-L Ms cohort with non-loaded microspheres; MsDexa cohort with microspheres loaded with dexamethasone; MsDexaFibro cohort with microspheres loaded with dexamethasone and fibronectin; EPIm cohort with sclerosis of the episcleral veins;*: statistical significance (p < 0.05) between glaucoma models and healthy controls (ANOVA); #: statistical significance between the episcleral vein sclerosis model and each microsphere model by Scheffé test.
