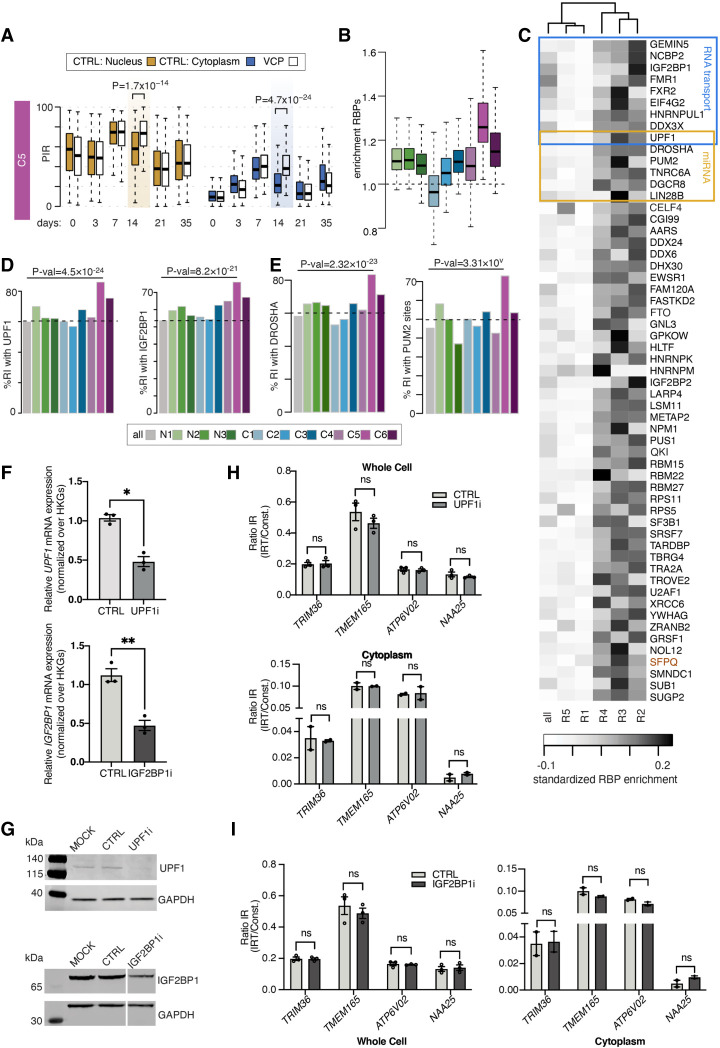
Figure 3.
Identification of a cytoplasmic group of retained introns with a high capacity for RBP and miRNA sequestration. (A) Comparison of the distributions of nuclear and cytoplasmic PIR between control (colored boxes) and VCPmu (white boxes) samples during MN differentiation for the C5 groups of cytoplasmic retained introns. Gold boxes indicate the time point at which the largest changes between control and VCPmu samples are observed. P-values obtained by two-sided Welch t-test. (B) Analysis of the enrichment in binding sites for 131 RBPs across the entire retained intron for all nine categories. Enrichment is obtained by dividing the fraction of retained introns in the category of interest with a CLIP binding with the fraction of retained introns in the complete set of introns (n = 61,872) with a cross-linking event. (C) Heatmap of the enrichment score of RBP cross-linking events in the entire intronic sequence (all) and, separately, in each of the five regulatory regions of the 270 retained introns of the C5 category. Fifty-seven RBPs show >19% higher fraction of binding to the C5 group compared with the full set of introns. Blue boxes indicate RBPs involved in RNA transport; gold boxes, RBPs involved in miRNA regulation. (D,E). Percentage of retained introns with cross-link events for two RBPs involved in RNA transport (UPF1 and IGF2BP1) and two RBPs involved in miRNA regulatory pathway (DROSHA and PUM2). Dotted lines indicate mean % of retained introns with cross-linking event. P-value from Fisher's exact test. (F) Bar graphs showing qPCR analysis of UPF1 (top) and IGF2BP1 (bottom) relative mRNA expression levels in MNs (DIV = 21) after being transfected with siRNA targeting UPF1 (UPF1i), IGF2BP1 (IGF2BP1i), or a scrambled control (CTRL). Values are normalized over the geometric mean of housekeeping genes (GAPDH, POLR2B, UBE2D3) and expressed as fold change over mock transfected cells. Data are presented as mean ± SEM. Data are derived from three individual cell lines, one experimental block. Paired t-test: (*) P < 0.05. (G) SDS-PAGE/western blotting showing expression levels of UPF1 (top), IGF2BP1 (bottom), and GAPDH (both) in MNs (DIV = 21) transfected with siRNA targeting UPF1, IGF2BP1, a scrambled control, or mock transfected cells (MOCK). GAPDH is assayed as a loading control. (H) Bar graphs showing qPCR analysis of candidate C5 IR levels in whole cell (top) and cytoplasmic (bottom) MN (DIV = 21) samples upon UPF1 knockdown. IR ratio values are calculated as levels of IRT over total transcript expression for each candidate. Data are presented as mean ± SEM. Data are derived from three individual cell lines (whole cell) and two individual cell lines (cytoplasmic), one experimental block. Multiple paired t-tests with significance placed at <0.05: (ns) not significant. (I) Same as H, with siRNA targeting IGF2BP1 and whole cell (left) and cytoplasmic (right).

