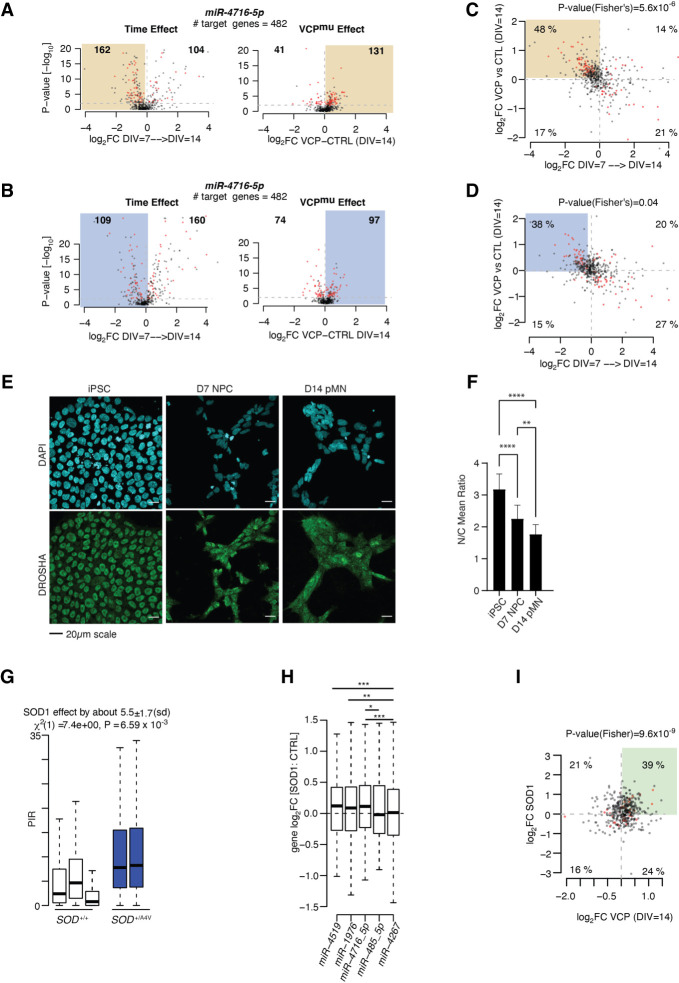
Figure 5.
ALS-related transient accumulation in cytoplasmic retained introns correlates with reduced miRNA activity. (A) Volcano plots representing the effect size (i.e., log2(fold-change) on the x-axis) against the statistical significance (i.e., −log10(P-value) on the y-axis) of the changes in the nucleus in gene expression between two consecutive time points from DIV = 7 to DIV = 14 for control cell lines (left) and between control and VCP mutant cell lines at DIV = 14 time point (right) for the TargetScan predicted target genes of miR-4716-5p. (B) Same as A but for cytoplasmic gene expression changes. (C) Scatter plots showing the relationships of the expression changes between DIV = 7 and DIV = 14 in nuclear control samples (x-axis; log2FC) and between control and VCPmu cell lines at DIV = 14 (y-axis; log2FC) of the predicted target genes for miR-4716-5p. Red color indicates genes with P-value < 0.01 in both comparisons. P-value obtained from one-side Fisher's exact test comparing the number of genes showing log2FC(DIV = 7 → DIV = 14) < 0 and log2FC(VCP vs. CTRL at DIV = 14) in the pool of miRNA predicted targets with those from the total set of genes. (D) Same as C but for cytoplasm. (E) Representative images of DROSHA (green) and DAPI (blue) in iPSC, NPC (DIV = 7), and pMN (DIV = 14) time points of control cells. (F) Nuclear-to-cytoplasmic ratio of mean DROSHA intensity is plotted for iPSC, NPC (DIV = 7), and pMN (DIV = 14) cell stages. Two-way ANOVA: (ns) nonsignificant, (*) P < 0.05, (**) P < 0.01, (***) P < 0.001, (****) P < 0.0001. Data are derived from n = 5 cell lines, one experimental repeat. (G) Boxplots displaying the distribution of PIR for the 270 introns of the C5 category in control MN (white box) and SOD1mu MN samples (blue bar; left) (Kiskinis et al. 2014). SOD1mu samples show a systematically higher proportion of IR compared with controls. Linear mixed effects analysis of the relationship between the PIR for the 270 introns and SOD1 mutation was used to account for idiosyncratic variation owing to patient differences. (H) Distributions of the changes in expression between SOD1mu and control samples for the predicted target genes of miR-4519, miR-1976, miR-4716-5p, miR-485-5p, and miR-4267. (I) Scatter plot showing the relationships of the expression changes between DIV = 14 VCPmu (x-axis; log2FC) and SOD1mu (y-axis; log2FC) samples of the predicted target genes for miR-4716-5p. Red color indicates genes with P-value < 0.01 in both comparisons. P-value obtained from one-side Fisher's exact test comparing the number of genes showing log2FC(SOD1 vs. CTRL) > 0 and log2FC(VCP vs. CTRL at DIV = 14) > 0 in the pool of miRNA predicted targets with those from the total set of genes. (G,H) Data shown as box plots in which the center line is the median; limits are the interquartile range; and whiskers are the minimum and maximum.

