Figure 1.
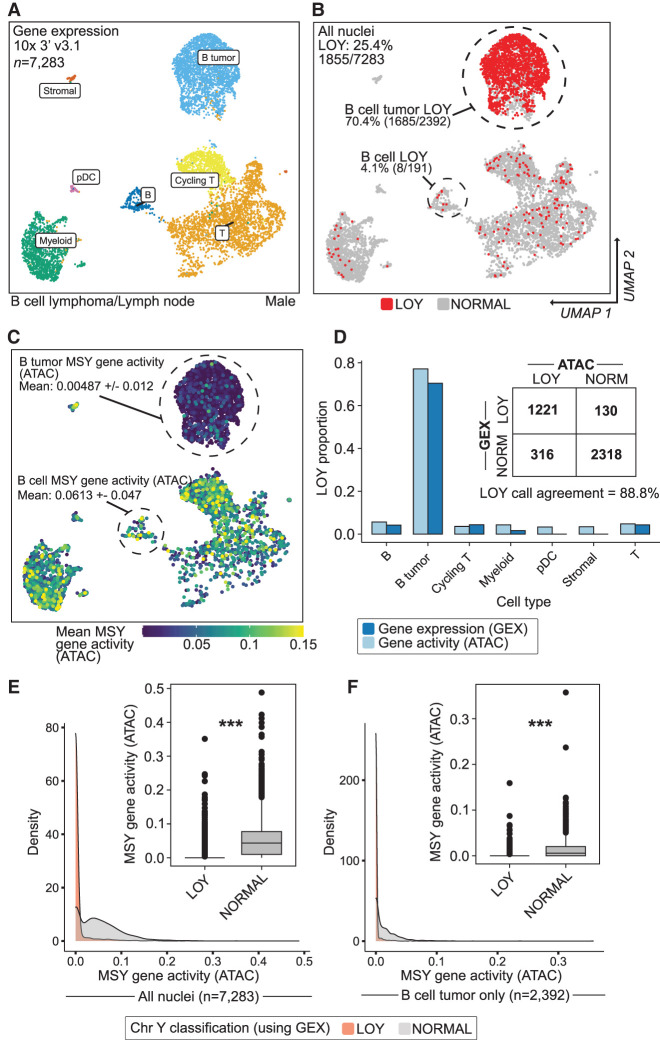
snRNA-seq agrees with snATAC-seq when classifying Y Chromosome loss using a multimodal data set. (A) UMAP projection and cell type identities after clustering 7283 thyroid nuclei (snRNA-seq) from a male donor with non-Hodgkin's lymphoma. (B) snRNA-seq clustering of LOY nuclei (red) and non-LOY/normal nuclei (gray; more than 3000 nUMI and more than 1000 nGene). (C) UMAP projection (snRNA-seq) colored by snATAC-seq-derived gene-activity scores of male-specific Y genes using Signac. (D) LOY estimates from ATAC and gene expression assays for each cell type. Inset table shows total nuclei arranged by LOY classification and assay. ATAC and gene expression LOY classification agreed in 88.8% of nuclei. (E,F) Density of ATAC gene activity in LOY (red) and normal (gray) nuclei for all nuclei (E) and B cell cancer nuclei only (F). Wilcoxon, one-sided: (***) P < 0.001.

