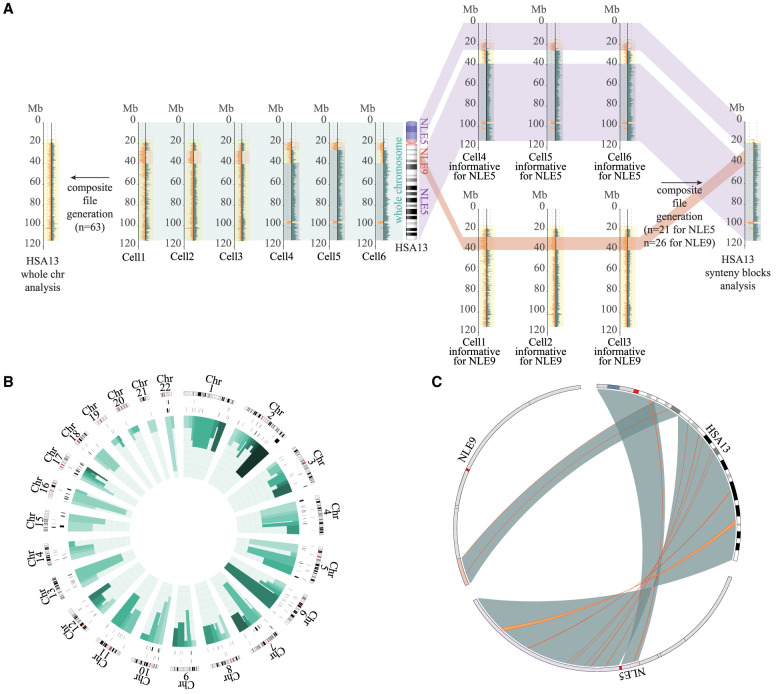
Figure 1.
Strand-seq data analysis. (A) Schematic view of the method used to generate the Chr 13 composite file for the detection of the inversions. In the middle, an ideogram of human Chromosome 13 (HSA13) and the corresponding synteny blocks relative to Nomascus (NLE5 or NLE9) is shown. (Left) If single-cell Strand-seq data are pooled directly (Strand-seq output for six single cells is shown as an example) without taking into account the human–gibbon synteny block information, the resulting composite file will show no informative strand-state information (reads will map to both Watson and Crick strands equally, so every chromosome appears as WC). (Right) The method used in the present study considers human–gibbon synteny blocks individually to select libraries for generating a composite file separately for each syntenic region. Only informative libraries for each synteny block are selected and merged to generate a composite file of the whole chromosome. (B) Circos diagram (Krzywinski et al. 2009) reporting detected inversions for each human chromosome ideogram, with heterozygous inversions in the external circle and homozygous inversions in the inner circle. Green bars indicate the number of inversions detected for each synteny block (shown in different shades of green), where the height is proportional to the number of inversions detected for that block (min = 0; max = 9). (C) Circos diagram (Krzywinski et al. 2009) exemplifying the results of the analysis for a single human chromosome. Human–gibbon synteny blocks for human Chr 13 (large green highlights) and the inversions detected within each block (thin orange lines) are shown.

