Figure 3.
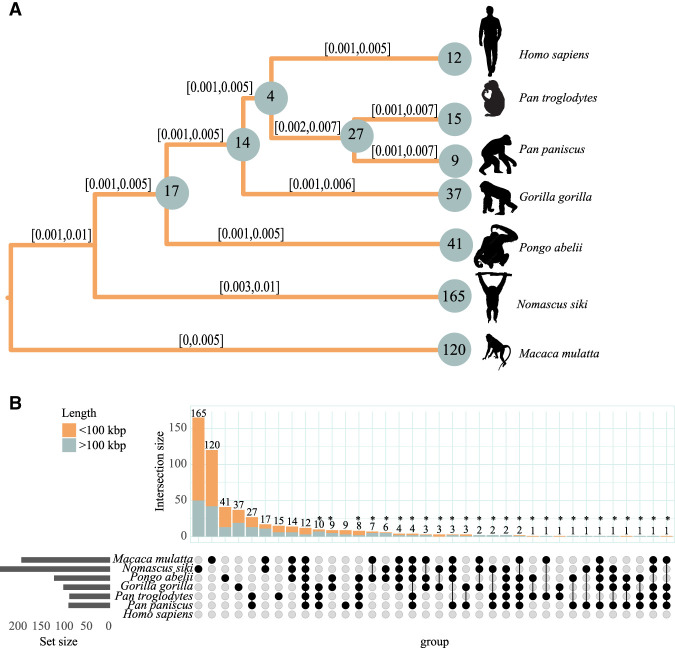
High inversion rates in Nomascus revealed by distance-based and Bayesian analysis. (A) Evolutionary tree based on Markov chain Monte Carlo based on a set of 536 inversions considering both homozygous and heterozygous presence (see Methods). For each branch, the 95% posterior density confidence interval is reported. Numbers on nodes refer to shared inversion presence on the underlying subtrees, and numbers on branches refer to private inversions. (B) Upset plot of a set of 536 inversions. The upper barplot refers to the number of inversions observed in the species indicated in the intersection matrix. The left barplot refers to the total number of inversions identified for each species. Bar colors refer to the length of the inversions, as shown in the legend. Inversions putatively assigned to incomplete lineage sorting and/or recurrence were annotated with an asterisk. The silhouette of the chimpanzee is created by T. Michael Keesey and Tony Hisgett (PhyloPic; http://phylopic.org/; image is under a Creative Commons Attribution 3.0 unported license); silhouettes of bonobo and gorilla are from PhyloPic under a Public Domain Dedication 1.0 license, and the silhouette of the macaque is from PhyloPic under a Public Domain Mark 1.0 license.

