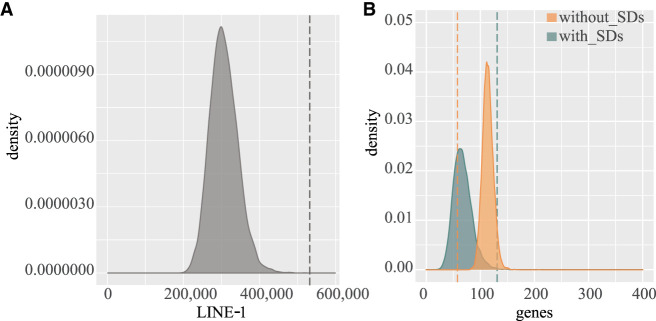
Figure 4.
Gene density and repeat content at inversion breakpoints. (A) The panel shows data comparisons for LINE-1 between 10,000 random clusters of shuffled regions (gray area) and gibbon-specific BP regions devoid of SDs (dashed line) in human GRCh38. (B) The panel shows the gene content of 10,000 random clusters of shuffled regions, chosen in genomic segments with (green area) and without (orange area) SDs, compared with the gene content at gibbon-specific inversion BPs with (green dashed line) and without (orange dashed line) SDs.

