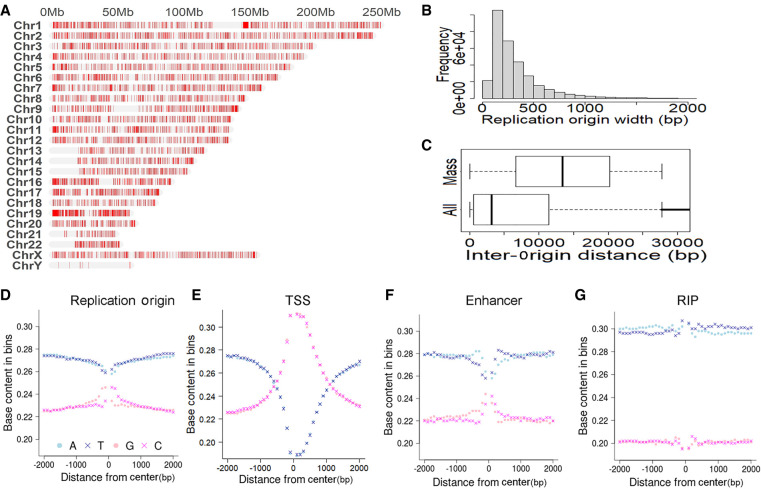
Figure 2.
Description of built-in genomic features: replication origins and others. (A) Landscape view of replication origins on human chromosomes. (B) Distribution of width/length of replication origins. (C) Distribution of inter-origin distance. Long, barren intervals appear as outliers in the whole-data set view (All). Thus, we excluded the outliers and showed the distance boxplot for the mass component (Mass). (D) Nucleotide base content in (−2 k, 2 k) flanking regions of replication origins. (E) Nucleotide base content in (−2 k, 2 k) flanking regions of transcription start sites (TSSs). (F) Nucleotide base content in (−2 k, 2 k) flanking regions of enhancers. (G) Nucleotide base content in (−2 k, 2 k) flanking regions of retrotransposon insertion polymorphism (RIP) sites.

