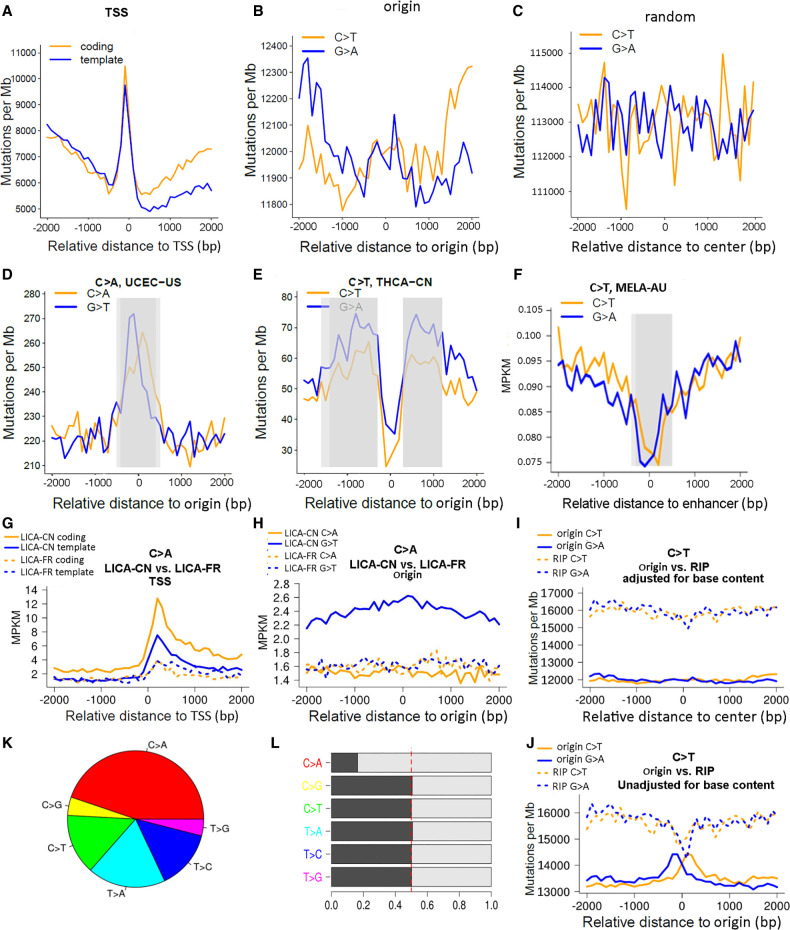
Figure 4.
Representative plots generated by MutDens in case studies of ICGC mutation data sets. (A–C) Mutation density curves of C > T mutations in the MELA-AU cohort, analyzed against three different genomic position sets: TSSs (A), replication origins (B), and random sites (C). (D–F) Distinct mutation density patterns were identified and marked in gray rectangles, including central peak of origins (D), off-center peaks of origins (E), and central dip of enhancers (F). (G–J) Four mutation density curves were aligned side by side as a result of comparing two cohorts (G,H) or comparing two position sets (I,J). When TSSs were in focus, LICA-CN displayed evidently greater C > A mutation density than LICA-FR, for both the coding strands and the template strands (G). When replication origins were in focus, LICA-CN outnumbered LICA-FR only in terms of the G > T mutations but not the C > A mutations (H). Speaking of MELA-AU C > T mutations, mutation density levels around replication origins were lower than those around RIP sites (I). If the background base content near Origins and RIP sites had not been taken into account, two near-center peaks would have shown up for Origin mutation density curves (J). (K) Mutational class distribution in the LICA-CN cohort. (L) Mutations in LICA-CN's each mutational class were divided into two complementary forms, where asymmetry between the C > A and G > T form pairs was prominent.

